

Telus announces C$900 million savings plan: Can T regain momentum?

Telus (T) stock is trading at C$12.54 after a modest decline for the session, with the price sitting below its key moving averages.
 12.84
13.25
Highlights
- Telus stock saw service revenue slip 1%, adjusted EBITDA fall 5%, and free cash flow contract 35% in the third quarter.
- The company aims for C$900 million in annual cost savings by 2028 through cost reductions, capital efficiency initiatives, and exploring PureFibre network partnerships.
- Shares of Telus trade below key moving averages with a bearish bias, an expected short-term range of C$12.19 to C$12.89, and 65% probability of further downside.
Profitability strain drives restructuring and market caution
Telus Corp reported weaker third-quarter results as service revenue declined 1%, adjusted EBITDA dropped 5%, free cash flow fell 35%, and adjusted earnings per share decreased to C$0.16, according to TradingView. These results highlight ongoing challenges in operational profitability and underline margin pressures faced by the company. In response, Telus has announced plans to generate C$900 million in annual savings by 2028 through a series of cost cuts, capital efficiency measures, and asset sales, and is in early discussions with potential partners to unlock value from its PureFibre network, as reported by TradingView. The combination of short-term earnings softness and long-term restructuring signals is shaping overall sentiment in the current market context.
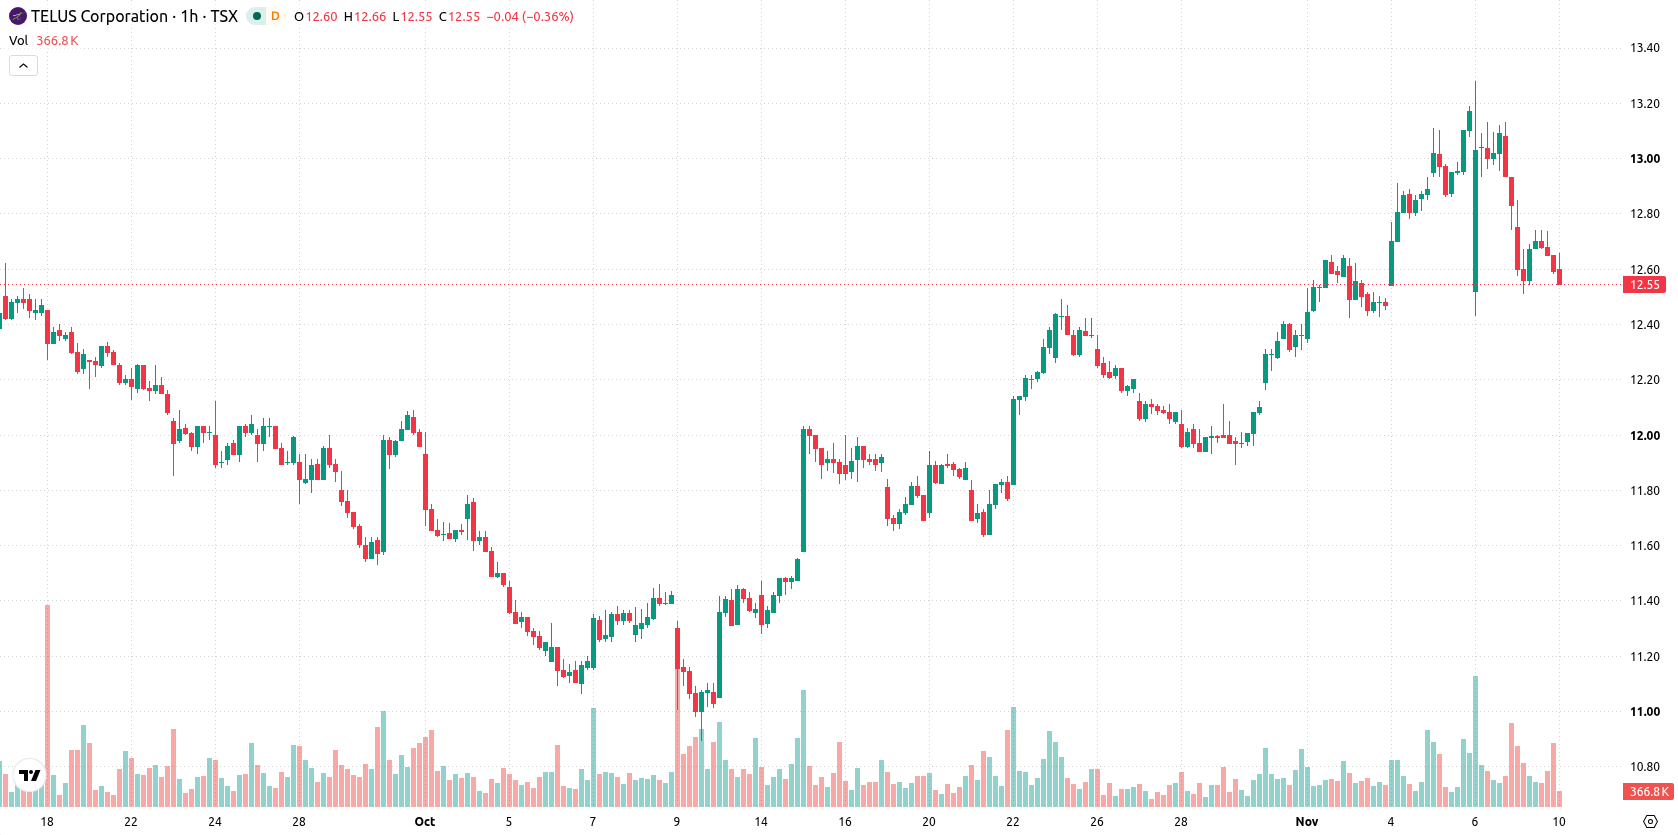
Multi-horizon downside persists amid mixed momentum signals
On the H1 chart, T trades below the MA-20 and MA-50, with price positioned well under the long-term MA-200, highlighting multi-horizon pressure. The Ichimoku Kijun at C$12.86 is identified as immediate resistance. Momentum readings are mixed: MACD and Awesome Oscillator are neutral, while ADX registers a sell signal. Sellers hold a narrow advantage based on Bull/Bear Power at -0.1. RSI remains in the neutral zone, but both Stoch RSI and CCI are in oversold territory, suggesting selling exhaustion as the price hovers near today's lows.
Stabilization expected unless support break triggers bearish move
Short-term scenarios favor a sideways move, with the typical volatility band seen between C$12.19 and C$12.89 for the next several sessions. The probability of an upward move is 35%, while the probability of continued downside stands at 65%. The primary scenario expects price stabilization within this corridor. A decisive breakout above C$12.86 would open a path toward higher levels, but a break below support at C$12.19 raises the risk of a further bearish extension.
Earlier, analysts noted that TELUS was facing profitability headwinds and embarking on restructuring initiatives, resulting in a cautious near-term outlook dependent on technical developments. The current analysis reinforces this view, with multi-horizon indicators signaling ongoing selling pressure and identifying C$12.19 as a critical support level to monitor for potential downside risk.










-
 Afghanistan
-
 Albania
-
 Algeria
-
 Angola
-
 Argentina
-
 Armenia
-
 Australia
-
 Austria
-
 Azerbaijan
-
 Bahamas
-
 Bahrain
-
 Bangladesh
-
 Belarus
-
 Belgium
-
 Bolivia
-
 Botswana
-
 Brazil
-
 Brunei
-
 Bulgaria
-
 Cambodia
-
 Cameroon
-
 Canada
-
 Chile
-
 China
-
 Colombia
-
 Congo
-
 Costa Rica
-
 Cote d'Ivoire
-
 Croatia
-
 Cuba
-
 Cyprus
-
 Czechia
-
 DR Congo
-
 Denmark
-
 Dominican Republic
-
 Ecuador
-
 Egypt
-
 El Salvador
-
 Estonia
-
 Eswatini
-
 Ethiopia
-
 Finland
-
 France
-
 Georgia
-
 Germany
-
 Ghana
-
 Greece
-
 Haiti
-
 Hong Kong
-
 Hungary
-
 India
-
 Indonesia
-
 Iran, Islamic republic
-
 Iraq
-
 Ireland
-
 Israel
-
 Italy
-
 Jamaica
-
 Japan
-
 Jordan
-
 Kazakhstan
-
 Kenya
-
 Korea
-
 Kuwait
-
 Kyrgyzstan
-
 Laos
-
 Latvia
-
 Lebanon
-
 Lesotho
-
 Libya
-
 Lithuania
-
 Luxembourg
-
 Madagascar
-
 Malaysia
-
 Malta
-
 Mauritius
-
 Mexico
-
 Moldova
-
 Mongolia
-
 Montenegro
-
 Morocco
-
 Mozambique
-
 Myanmar
-
 Namibia
-
 Nepal
-
 Netherlands
-
 New Zealand
-
 Nigeria
-
 North Macedonia
-
 Norway
-
 Oman
-
 Pakistan
-
 Palestine
-
 Panama
-
 Papua New Guinea
-
 Paraguay
-
 Peru
-
 Philippines
-
 Poland
-
 Portugal
-
 Puerto Rico
-
 Qatar
-
 Reunion
-
 Romania
-
 Rwanda
-
 Saudi Arabia
-
 Serbia
-
 Singapore
-
 Slovakia
-
 Slovenia
-
 Somalia
-
 South Africa
-
 Spain
-
 Sri Lanka
-
 Sweden
-
 Switzerland
-
 Syria
-
 Taiwan
-
 Tajikistan
-
 Tanzania
-
 Thailand
-
 Trinidad and Tobago
-
 Tunisia
-
 Turkey
-
 UAE
-
 Uganda
-
 Ukraine
-
 United Kingdom
-
United States
-
 Uruguay
-
 Uzbekistan
-
 Venezuela
-
 Vietnam
-
 Yemen
-
 Zambia
-
 Zimbabwe
- Forex
- Crypto












