


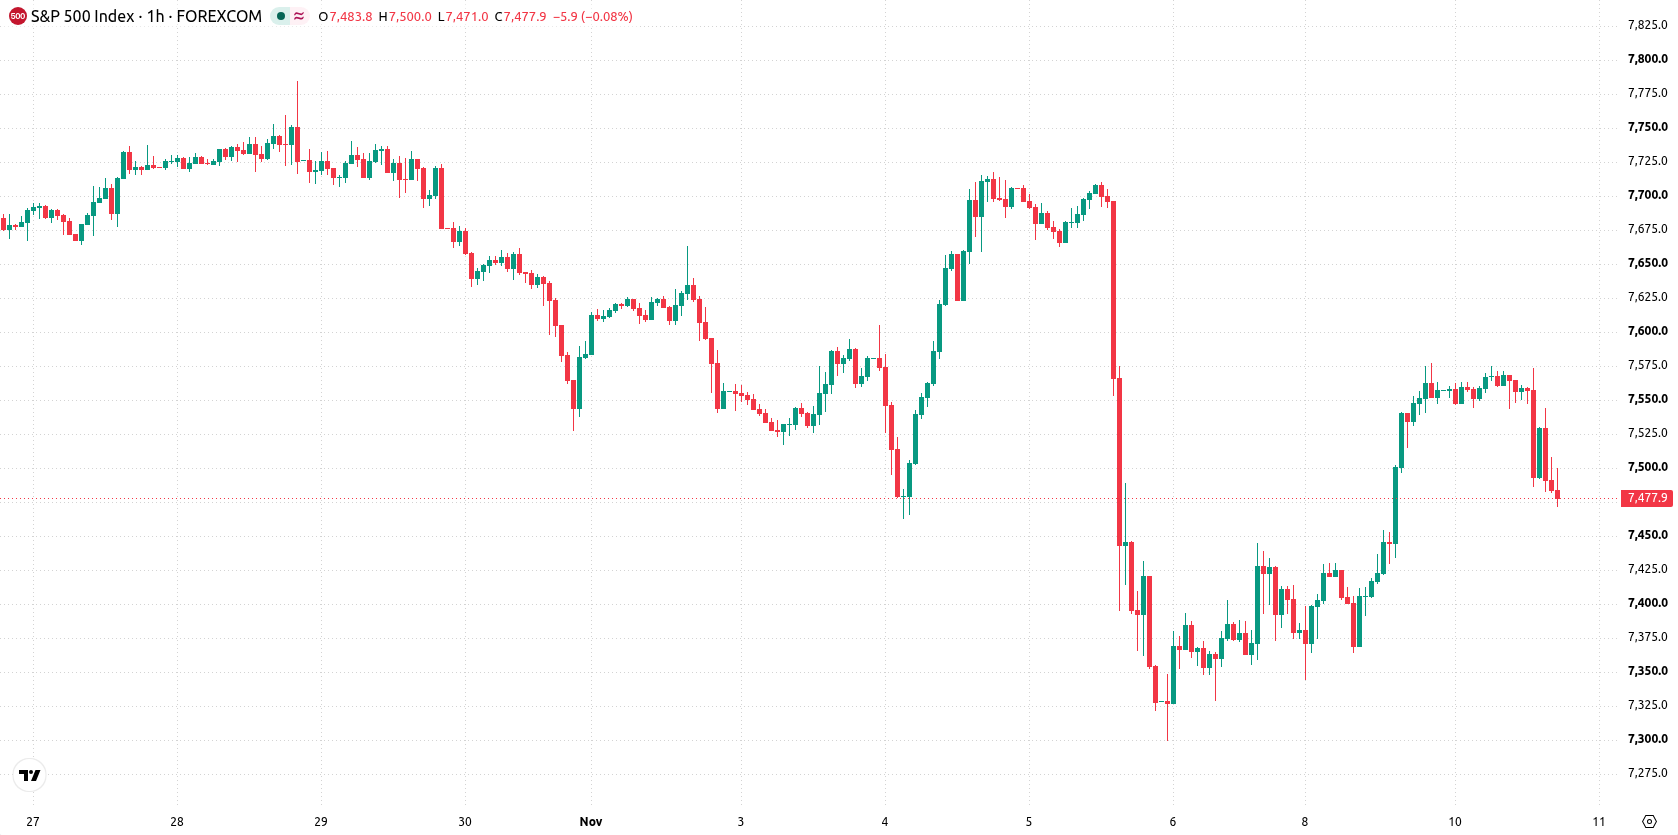
S&P 500 (SPX) is trading at 7,474, down 1% on the day and sitting near today’s session low. The index is currently positioned above its short-term average but below its medium-term average, reflecting mixed short- and medium-term momentum, while longer-term trend support remains intact.
 7621.78
7652.76
Highlights
- S&P 500 earnings growth slowed to 26% from 29% in the previous week, showing a decrease in profit momentum.
- All 11 sectors reported year-on-year revenue gains but aggregate profit growth continued to moderate, raising concerns about earnings sustainability.
- Technicals indicate index trading in a range from 7,393 to 7,555, with mixed momentum signals and higher probability of a downward move.
Earnings momentum slows as profit growth compresses despite revenue gains
S&P 500 earnings growth has slowed to 26% from 29% last week with 88% of companies having reported, reflecting a clear deceleration in profit momentum even as all 11 sectors recorded year-on-year revenue gains, according to Finimize. This broad-based revenue improvement has not prevented a moderation in the pace of aggregate profit growth, pointing to increasing concerns over the sustainability of elevated earnings levels. Marketscreener also noted this weekly moderation in earnings as characteristic of the current reporting cycle, suggesting that stable revenues have been insufficient to offset profit compression.
Resistance at 7,530 limits gains as momentum indicators stay mixed
On the hourly chart, price is trading above the MA-20 but remains below the MA-50, while staying above the MA-200 on the daily timeframe. The Ichimoku Kijun on the daily chart stands at 7,530, acting as immediate resistance. Intraday momentum signals are mixed: the MACD is neutral, while ADX flags a sell bias. The RSI, Stochastic RSI, and CCI all remain in neutral territory. Bull/Bear Power is positive at 29.28, pointing to slight buyer dominance during the session, and the Awesome Oscillator shows a neutral reading.
Downside risk increases as breakout odds remain muted
Over the next 2–3 days, the S&P 500 is likely to fluctuate within a range of 7,393 to 7,555, consistent with typical volatility for this asset. The probability of an upside breakout is assessed as very low, while a downward move is considered highly likely. Should price manage to move above the 7,530 resistance, a bullish scenario could unfold; however, if support at 7,393 is breached, selling momentum would likely intensify. The baseline expectation is for continued sideways price action within this defined range.
Earlier, analysts noted that the S&P 500 was facing near- and medium-term resistance as earnings growth slowed and mixed technical indicators pointed to uncertain direction. The current analysis affirms this cautious outlook, highlighting that the prevailing scenario is for continued range-bound trading, with a heightened risk of downside moves if key support levels are breached.










-
 Afghanistan
-
 Albania
-
 Algeria
-
 Angola
-
 Argentina
-
 Armenia
-
 Australia
-
 Austria
-
 Azerbaijan
-
 Bahamas
-
 Bahrain
-
 Bangladesh
-
 Belarus
-
 Belgium
-
 Bolivia
-
 Botswana
-
 Brazil
-
 Brunei
-
 Bulgaria
-
 Cambodia
-
 Cameroon
-
 Canada
-
 Chile
-
 China
-
 Colombia
-
 Congo
-
 Costa Rica
-
 Cote d'Ivoire
-
 Croatia
-
 Cuba
-
 Cyprus
-
 Czechia
-
 DR Congo
-
 Denmark
-
 Dominican Republic
-
 Ecuador
-
 Egypt
-
 El Salvador
-
 Estonia
-
 Eswatini
-
 Ethiopia
-
 Finland
-
 France
-
 Georgia
-
 Germany
-
 Ghana
-
 Greece
-
 Haiti
-
 Hong Kong
-
 Hungary
-
 India
-
 Indonesia
-
 Iran, Islamic republic
-
 Iraq
-
 Ireland
-
 Israel
-
 Italy
-
 Jamaica
-
 Japan
-
 Jordan
-
 Kazakhstan
-
 Kenya
-
 Korea
-
 Kuwait
-
 Kyrgyzstan
-
 Laos
-
 Latvia
-
 Lebanon
-
 Lesotho
-
 Libya
-
 Lithuania
-
 Luxembourg
-
 Madagascar
-
 Malaysia
-
 Malta
-
 Mauritius
-
 Mexico
-
 Moldova
-
 Mongolia
-
 Montenegro
-
 Morocco
-
 Mozambique
-
 Myanmar
-
 Namibia
-
 Nepal
-
 Netherlands
-
 New Zealand
-
 Nigeria
-
 North Macedonia
-
 Norway
-
 Oman
-
 Pakistan
-
 Palestine
-
 Panama
-
 Papua New Guinea
-
 Paraguay
-
 Peru
-
 Philippines
-
 Poland
-
 Portugal
-
 Puerto Rico
-
 Qatar
-
 Reunion
-
 Romania
-
 Rwanda
-
 Saudi Arabia
-
 Serbia
-
 Singapore
-
 Slovakia
-
 Slovenia
-
 Somalia
-
 South Africa
-
 Spain
-
 Sri Lanka
-
 Sweden
-
 Switzerland
-
 Syria
-
 Taiwan
-
 Tajikistan
-
 Tanzania
-
 Thailand
-
 Trinidad and Tobago
-
 Tunisia
-
 Turkey
-
 UAE
-
 Uganda
-
 Ukraine
-
 United Kingdom
-
United States
-
 Uruguay
-
 Uzbekistan
-
 Venezuela
-
 Vietnam
-
 Yemen
-
 Zambia
-
 Zimbabwe
- Forex
- Crypto












