

Palo Alto Networks shares technical analysis: Seller pressure dominates despite long-term support

Palo Alto Networks (PANW) stock is trading at $321.5, reflecting a daily decline of 2.97%. The current price sits below key short- and medium-term moving averages but remains above the long-term average, pointing to a mixed technical backdrop.
 366.79
370.00
Highlights
- Palo Alto Networks reported full-year revenue of $11.48 billion and net profit of $307 million, confirming sustained profitability and operational scale.
- ETF net purchases totaled $59.4 million on November 6, 2026, following two days of net selling in the stock.
- Shares of Palo Alto Networks trade below short- and medium-term moving averages with strong sell momentum, and price is expected to remain in a $299.7 to $343.3 range with high probability of further downside.
ETF buying resumes as institutional flows shift amid recent selling
Palo Alto Networks reported full-year revenue of $11.48 billion and net profit of $307 million, demonstrating sustained operational profitability and scale, according to Gurufocus. This fundamental backdrop has supported institutional interest, as evidenced by ETF activity: on November 6, 2026, $59.4 million in net ETF purchases reversed two consecutive days of net selling, based on data from Gurufocus. The resumption of ETF buying points to a tentative rebound in fund flow dynamics, even as recent trading has been dominated by selling pressure.
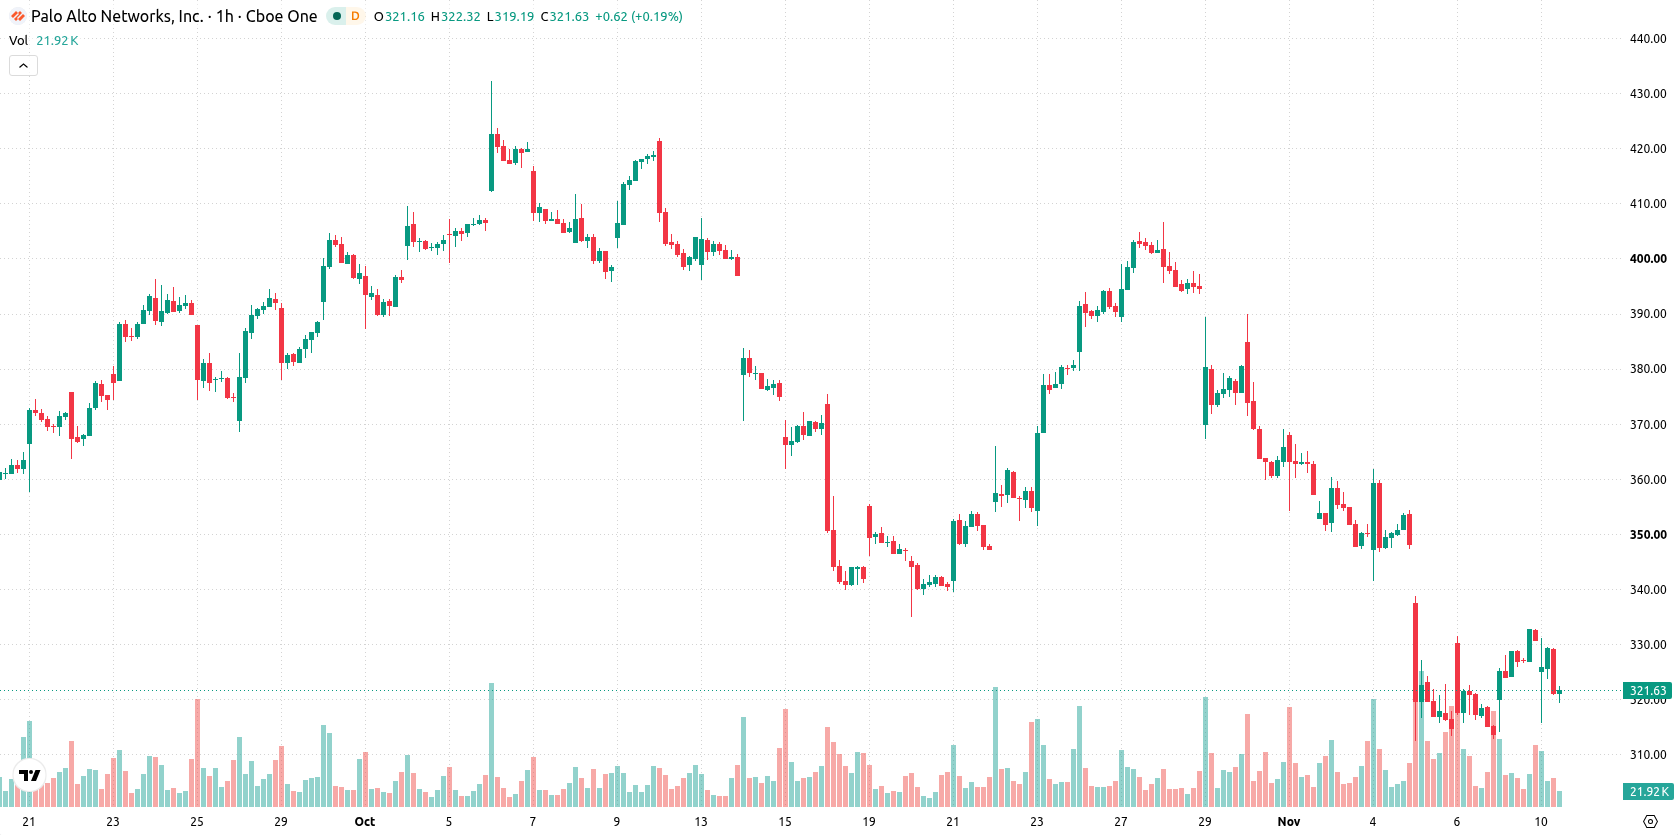
Sell pressure intensifies as major indicators diverge on momentum
Technical analysis shows PANW trading below the MA-20 and MA-50, marking short- and medium-term price pressure, while remaining above the MA-200, which preserves longer-term support. The Ichimoku Kijun stands at $333.28, serving as immediate resistance. MACD signals a strong sell bias, and ADX confirms a prevailing sell environment. RSI, Stoch RSI, and CCI remain neutral, presenting no extremes, with Bull/Bear Power positive at 1.51 to indicate sporadic intraday buyer activity. The Awesome Oscillator displays a neutral tone, pointing to mixed momentum conditions and divergence between oscillators and trend indicators.
Downside risk elevated as price teeters near lower volatility bound
In the immediate term, PANW is expected to trade within a broad volatility band between $299.7 and $343.3. The likelihood of an upward breakout is very low, while the risk of a further decline is high if support near the lower bound is breached. The baseline scenario remains range-bound price action, with any bullish case requiring a move above $333.28 and eventual expansion above $343.3, while persistent weakness may accelerate should the price fall below established support.
Previously it was reported that Palo Alto Networks exhibited mixed technical signals with potential for both downside risk and bullish reversal scenarios. The latest analysis adds that, with the stock now exhibiting increased selling pressure but continued institutional ETF support, traders should closely monitor the $299.7 support level and the $333.28 resistance as key triggers for the next directional move.






Latest Palo Alto Networks News





-
 Afghanistan
-
 Albania
-
 Algeria
-
 Angola
-
 Argentina
-
 Armenia
-
 Australia
-
 Austria
-
 Azerbaijan
-
 Bahamas
-
 Bahrain
-
 Bangladesh
-
 Belarus
-
 Belgium
-
 Bolivia
-
 Botswana
-
 Brazil
-
 Brunei
-
 Bulgaria
-
 Cambodia
-
 Cameroon
-
 Canada
-
 Chile
-
 China
-
 Colombia
-
 Congo
-
 Costa Rica
-
 Cote d'Ivoire
-
 Croatia
-
 Cuba
-
 Cyprus
-
 Czechia
-
 DR Congo
-
 Denmark
-
 Dominican Republic
-
 Ecuador
-
 Egypt
-
 El Salvador
-
 Estonia
-
 Eswatini
-
 Ethiopia
-
 Finland
-
 France
-
 Georgia
-
 Germany
-
 Ghana
-
 Greece
-
 Haiti
-
 Hong Kong
-
 Hungary
-
 India
-
 Indonesia
-
 Iran, Islamic republic
-
 Iraq
-
 Ireland
-
 Israel
-
 Italy
-
 Jamaica
-
 Japan
-
 Jordan
-
 Kazakhstan
-
 Kenya
-
 Korea
-
 Kuwait
-
 Kyrgyzstan
-
 Laos
-
 Latvia
-
 Lebanon
-
 Lesotho
-
 Libya
-
 Lithuania
-
 Luxembourg
-
 Madagascar
-
 Malaysia
-
 Malta
-
 Mauritius
-
 Mexico
-
 Moldova
-
 Mongolia
-
 Montenegro
-
 Morocco
-
 Mozambique
-
 Myanmar
-
 Namibia
-
 Nepal
-
 Netherlands
-
 New Zealand
-
 Nigeria
-
 North Macedonia
-
 Norway
-
 Oman
-
 Pakistan
-
 Palestine
-
 Panama
-
 Papua New Guinea
-
 Paraguay
-
 Peru
-
 Philippines
-
 Poland
-
 Portugal
-
 Puerto Rico
-
 Qatar
-
 Reunion
-
 Romania
-
 Rwanda
-
 Saudi Arabia
-
 Serbia
-
 Singapore
-
 Slovakia
-
 Slovenia
-
 Somalia
-
 South Africa
-
 Spain
-
 Sri Lanka
-
 Sweden
-
 Switzerland
-
 Syria
-
 Taiwan
-
 Tajikistan
-
 Tanzania
-
 Thailand
-
 Trinidad and Tobago
-
 Tunisia
-
 Turkey
-
 UAE
-
 Uganda
-
 Ukraine
-
 United Kingdom
-
United States
-
 Uruguay
-
 Uzbekistan
-
 Venezuela
-
 Vietnam
-
 Yemen
-
 Zambia
-
 Zimbabwe
- Forex
- Crypto












