

Meta Platforms stock buyers struggle to regain control as volatility remains high: weekly analysis

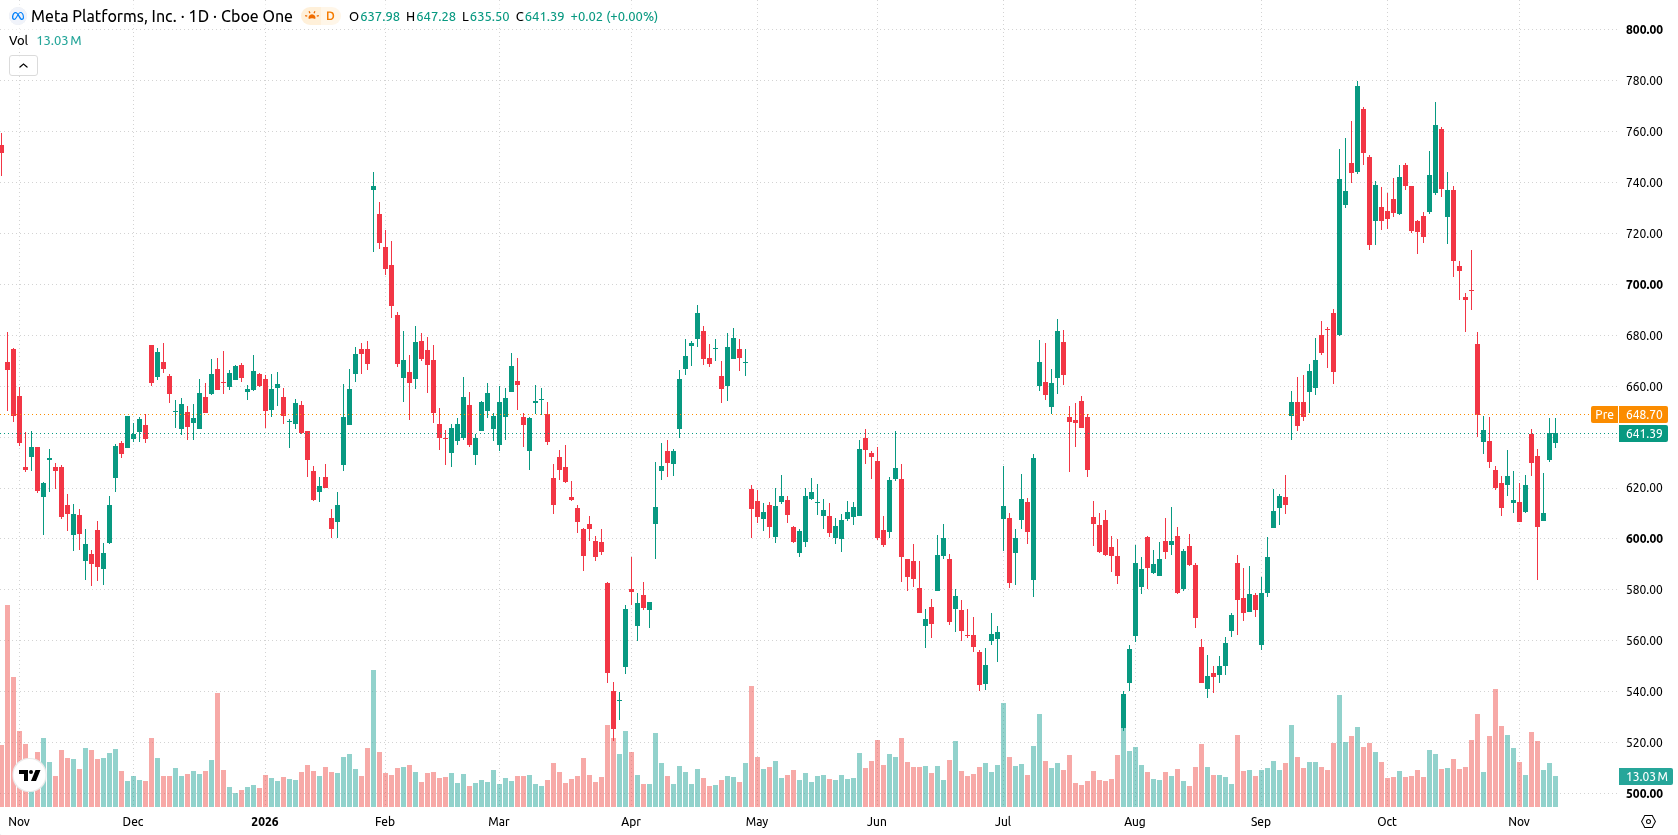
Shares of Meta Platforms (META, formerly Facebook, Inc.) are trading near $642 after gaining more than 5% this past week, as buyers face difficulty reestablishing momentum. The weekly chart shows conflicting technical signals, with volatility remaining high even as directional conviction appears limited. The coming days will hinge on whether buyers can reclaim control or if recent volatility leads to more pronounced downside risk.
 643.91
647.20
Highlights
- Shares of Meta Platforms rose 5.18% over the past week to $641.8, holding near the upper end of their recent range.
- Short-term indicators show the stock is overbought and momentum is near-term overheated, with underlying trend direction remaining mixed.
- For the next five trading days, the expected range is $613.85 to $669.74, with resistance at $647.2 and support at $631.68.
Profit drop and AI spending shape sentiment amid halted buybacks
Meta's latest quarterly earnings report triggered notable volatility after the company recorded a $9.89 billion legal charge, which sharply reduced profits even as advertising revenue continued to grow, according to Yahoo Finance. The rising investment in artificial intelligence and automation led to negative free cash flow for the quarter as reported by Yahoo Finance. Bloomberg highlighted that Meta halted all share buybacks in 2026 to prioritize AI infrastructure spending, and the company also paused updates to its terms of service this week, according to Investing.com.
Strong sell signals emerge as stochastic RSI flags overheating
On the daily chart, price action has staged a sharp move higher without a sustained trend, with volatility over the past 7 days at 10.69%. MACD signals a strong sell, while Stochastic RSI is overbought at 100, flagging possible near-term overheating. The RSI and CCI both sit in neutral territory, creating a divergence as price approaches key levels. Immediate resistance stands at the recent high of $647.2, while support lies at the MA-200 at $631.68.
Downside risk prevails as momentum consolidates within broad range
For the next five trading days, the expected range is $613.85 to $669.74, with a 41% probability of an increase and a 59% probability of a decrease. The base case sees the stock navigating between support at $631.68 and resistance at $647.2 as momentum consolidates. A sustained push above $647.2 would open the way toward $669.74, while a drop below $631.68 could expose the lower boundary near $613.85.
Previously it was reported that Meta received a substantial fine from Brazil's top electoral court due to incomplete compliance with judicial orders related to election content. Recent developments add a fresh dimension, as heightened volatility and legal expenses now place a spotlight on the $631.68 support level, which traders should monitor closely for potential downside breaks in the coming sessions.






Latest META News





-
 Afghanistan
-
 Albania
-
 Algeria
-
 Angola
-
 Argentina
-
 Armenia
-
 Australia
-
 Austria
-
 Azerbaijan
-
 Bahamas
-
 Bahrain
-
 Bangladesh
-
 Belarus
-
 Belgium
-
 Bolivia
-
 Botswana
-
 Brazil
-
 Brunei
-
 Bulgaria
-
 Cambodia
-
 Cameroon
-
 Canada
-
 Chile
-
 China
-
 Colombia
-
 Congo
-
 Costa Rica
-
 Cote d'Ivoire
-
 Croatia
-
 Cuba
-
 Cyprus
-
 Czechia
-
 DR Congo
-
 Denmark
-
 Dominican Republic
-
 Ecuador
-
 Egypt
-
 El Salvador
-
 Estonia
-
 Eswatini
-
 Ethiopia
-
 Finland
-
 France
-
 Georgia
-
 Germany
-
 Ghana
-
 Greece
-
 Haiti
-
 Hong Kong
-
 Hungary
-
 India
-
 Indonesia
-
 Iran, Islamic republic
-
 Iraq
-
 Ireland
-
 Israel
-
 Italy
-
 Jamaica
-
 Japan
-
 Jordan
-
 Kazakhstan
-
 Kenya
-
 Korea
-
 Kuwait
-
 Kyrgyzstan
-
 Laos
-
 Latvia
-
 Lebanon
-
 Lesotho
-
 Libya
-
 Lithuania
-
 Luxembourg
-
 Madagascar
-
 Malaysia
-
 Malta
-
 Mauritius
-
 Mexico
-
 Moldova
-
 Mongolia
-
 Montenegro
-
 Morocco
-
 Mozambique
-
 Myanmar
-
 Namibia
-
 Nepal
-
 Netherlands
-
 New Zealand
-
 Nigeria
-
 North Macedonia
-
 Norway
-
 Oman
-
 Pakistan
-
 Palestine
-
 Panama
-
 Papua New Guinea
-
 Paraguay
-
 Peru
-
 Philippines
-
 Poland
-
 Portugal
-
 Puerto Rico
-
 Qatar
-
 Reunion
-
 Romania
-
 Rwanda
-
 Saudi Arabia
-
 Serbia
-
 Singapore
-
 Slovakia
-
 Slovenia
-
 Somalia
-
 South Africa
-
 Spain
-
 Sri Lanka
-
 Sweden
-
 Switzerland
-
 Syria
-
 Taiwan
-
 Tajikistan
-
 Tanzania
-
 Thailand
-
 Trinidad and Tobago
-
 Tunisia
-
 Turkey
-
 UAE
-
 Uganda
-
 Ukraine
-
 United Kingdom
-
United States
-
 Uruguay
-
 Uzbekistan
-
 Venezuela
-
 Vietnam
-
 Yemen
-
 Zambia
-
 Zimbabwe
- Forex
- Crypto












