

S&P 500 forecast: Bulls eye 7,677 resistance as upward trend persists

S&P 500 (SPX) is trading at 7,604, showing a daily gain of 1.1%. The index remains positioned above its key moving averages, reflecting ongoing upward momentum.
 7412.76
7649.65
Highlights
- The S&P 500 is advancing, supported by renewed buying in technology and semiconductor stocks and declining volatility.
- Market rotation into growth and higher beta equities is generating broad-based demand for U.S. indices, with stock index futures indicating a higher open.
- The index trades in a bullish structure above key moving averages, with an expected range of 7,530 to 7,677 and a 71% probability of further upside.
Risk appetite surges amid tech rebound and volatility decline
The S&P 500 is seeing notable buying supported by a rebound in technology and semiconductor stocks, with a sharp fall in volatility as measured by the VIX, according to Tmgm. This turn in risk appetite has been especially evident as market participants rotate into growth sectors, favoring equities with higher beta. Stock index futures signal continuing demand, led by technology shares, with Benzinga reporting a higher open for U.S. equities. These developments combine to generate broad-based support for the S&P 500's advance.
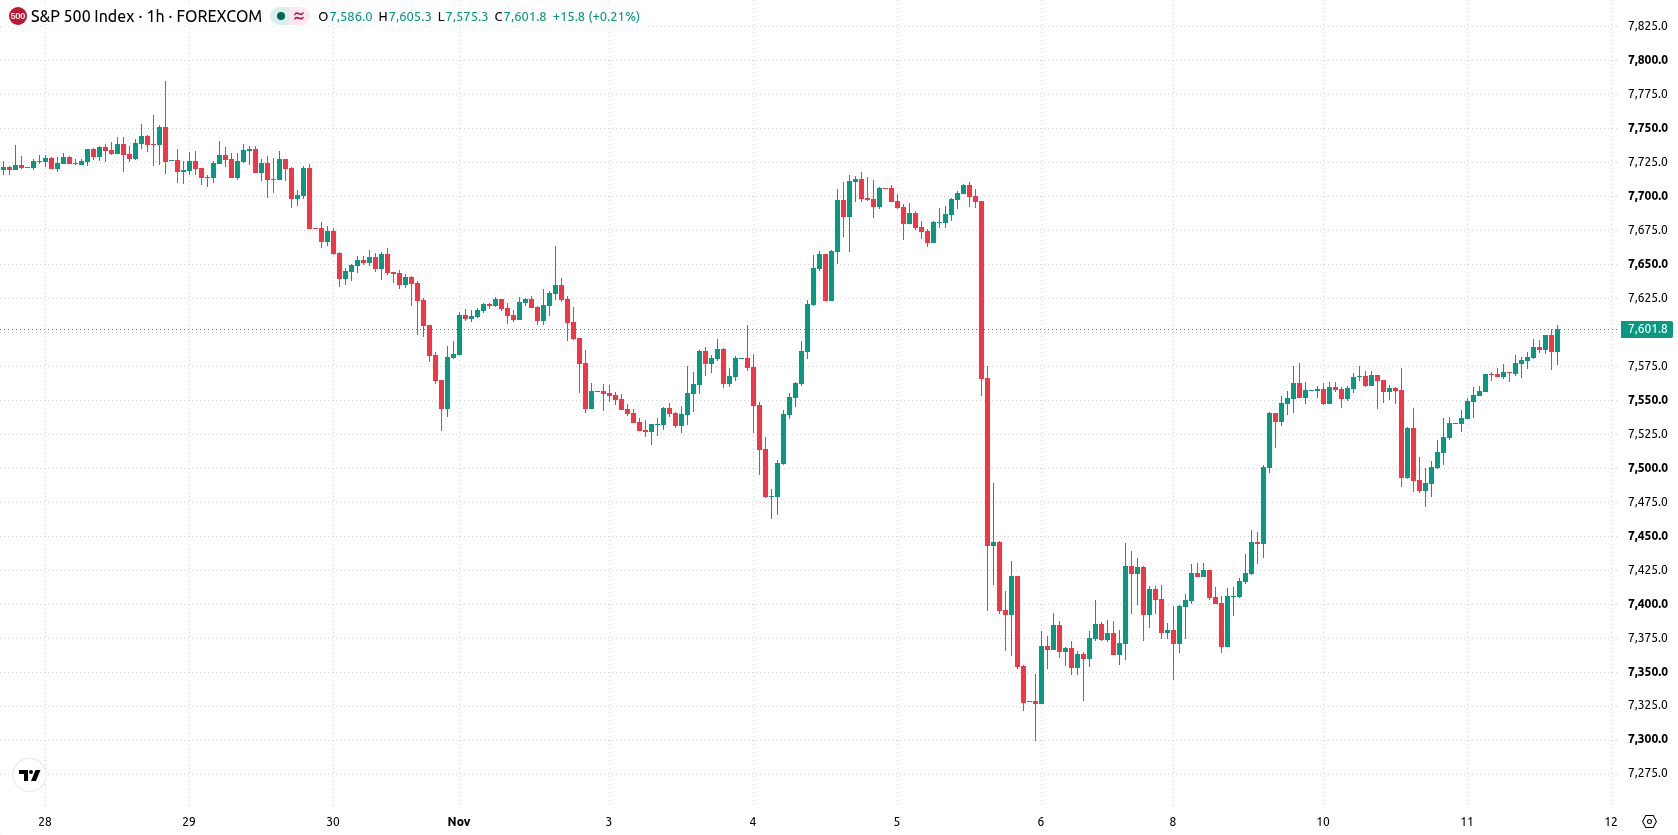
Bullish momentum as price nears resistance and oscillators stay neutral
On the technical front, SPX/USD is currently positioned above the MA-20, MA-50, and the long-term MA-200 on the working timeframe. The Ichimoku Kijun sits at 7,463, serving as immediate support for the index. MACD signals bullish momentum, while ADX remains neutral. Other oscillators—RSI, Stochastic RSI, and CCI—are also in neutral zones, with Bull/Bear Power remaining positive and the Awesome Oscillator neutral. The price action is near the top end of the recent range, with modest intraday volatility supporting continued buyer dominance on the session.
Higher continuation favored as price sets within projected range
Looking at the next one to two trading days, the expected trading range is 7,530 to 7,677, reflecting typical volatility relative to recent levels. The baseline scenario calls for prices to remain within this corridor, with a 71% probability favoring a continuation higher, while the likelihood of a move below 7,530 stands at 29%. A breakout above 7,677 would suggest further bullish momentum, while a drop under 7,530 would indicate a short-term reversal.
Previously it was reported that robust CoreWeave earnings and a rebound in Nvidia shares helped drive gains in technology stocks, lifting major U.S. equity futures. The current analysis reinforces this positive momentum in the S&P 500, with a continued focus on 7,677 as the key resistance level to monitor for signs of further upside.











-
 Afghanistan
-
 Albania
-
 Algeria
-
 Angola
-
 Argentina
-
 Armenia
-
 Australia
-
 Austria
-
 Azerbaijan
-
 Bahamas
-
 Bahrain
-
 Bangladesh
-
 Belarus
-
 Belgium
-
 Bolivia
-
 Botswana
-
 Brazil
-
 Brunei
-
 Bulgaria
-
 Cambodia
-
 Cameroon
-
 Canada
-
 Chile
-
 China
-
 Colombia
-
 Congo
-
 Costa Rica
-
 Cote d'Ivoire
-
 Croatia
-
 Cuba
-
 Cyprus
-
 Czechia
-
 DR Congo
-
 Denmark
-
 Dominican Republic
-
 Ecuador
-
 Egypt
-
 El Salvador
-
 Estonia
-
 Eswatini
-
 Ethiopia
-
 Finland
-
 France
-
 Georgia
-
 Germany
-
 Ghana
-
 Greece
-
 Haiti
-
 Hong Kong
-
 Hungary
-
 India
-
 Indonesia
-
 Iran, Islamic republic
-
 Iraq
-
 Ireland
-
 Israel
-
 Italy
-
 Jamaica
-
 Japan
-
 Jordan
-
 Kazakhstan
-
 Kenya
-
 Korea
-
 Kuwait
-
 Kyrgyzstan
-
 Laos
-
 Latvia
-
 Lebanon
-
 Lesotho
-
 Libya
-
 Lithuania
-
 Luxembourg
-
 Madagascar
-
 Malaysia
-
 Malta
-
 Mauritius
-
 Mexico
-
 Moldova
-
 Mongolia
-
 Montenegro
-
 Morocco
-
 Mozambique
-
 Myanmar
-
 Namibia
-
 Nepal
-
 Netherlands
-
 New Zealand
-
 Nigeria
-
 North Macedonia
-
 Norway
-
 Oman
-
 Pakistan
-
 Palestine
-
 Panama
-
 Papua New Guinea
-
 Paraguay
-
 Peru
-
 Philippines
-
 Poland
-
 Portugal
-
 Puerto Rico
-
 Qatar
-
 Reunion
-
 Romania
-
 Rwanda
-
 Saudi Arabia
-
 Serbia
-
 Singapore
-
 Slovakia
-
 Slovenia
-
 Somalia
-
 South Africa
-
 Spain
-
 Sri Lanka
-
 Sweden
-
 Switzerland
-
 Syria
-
 Taiwan
-
 Tajikistan
-
 Tanzania
-
 Thailand
-
 Trinidad and Tobago
-
 Tunisia
-
 Turkey
-
 UAE
-
 Uganda
-
 Ukraine
-
 United Kingdom
-
United States
-
 Uruguay
-
 Uzbekistan
-
 Venezuela
-
 Vietnam
-
 Yemen
-
 Zambia
-
 Zimbabwe
- Forex
- Crypto












