

Mastercard shares weekly forecast: Faces resistance at $676.57 with stable oscillators and firm trend

Shares of Mastercard Inc (MA) are holding steady near $661 after climbing more than 1% over the past week, as the stock sustains gains above key moving averages. With solid momentum from recent corporate results and resilient investor interest, MA enters the coming week set to test whether support can remain intact.
 662.75
667.51
Highlights
- Shares of Mastercard advanced 1.16% over the past week to $660.51, sustaining a strong upward trend.
- Technical indicators confirm bullish momentum with shares trading above key moving averages and trend signals remaining constructive.
- Expected range for the next week is $648.64 to $692.25, with immediate support at $650.04 and resistance at $676.57.
Earnings surge and new partnerships drive institutional repositioning this week
Mastercard reported strong third-quarter 2026 results, with revenue up 14% and earnings per share growing 21.2%, according to Seeking Alpha. The company also achieved 19% year-over-year services revenue growth, as reported by The Globe and Mail. On the institutional front, 71 West Capital Partners increased its holdings while Lockheed Martin Investment Management Co. reduced its position in the third quarter of 2026. Mastercard also expanded its business banking offerings through new partnerships, including the launch of the BMO CashBack World Elite Business Mastercard in Canada.
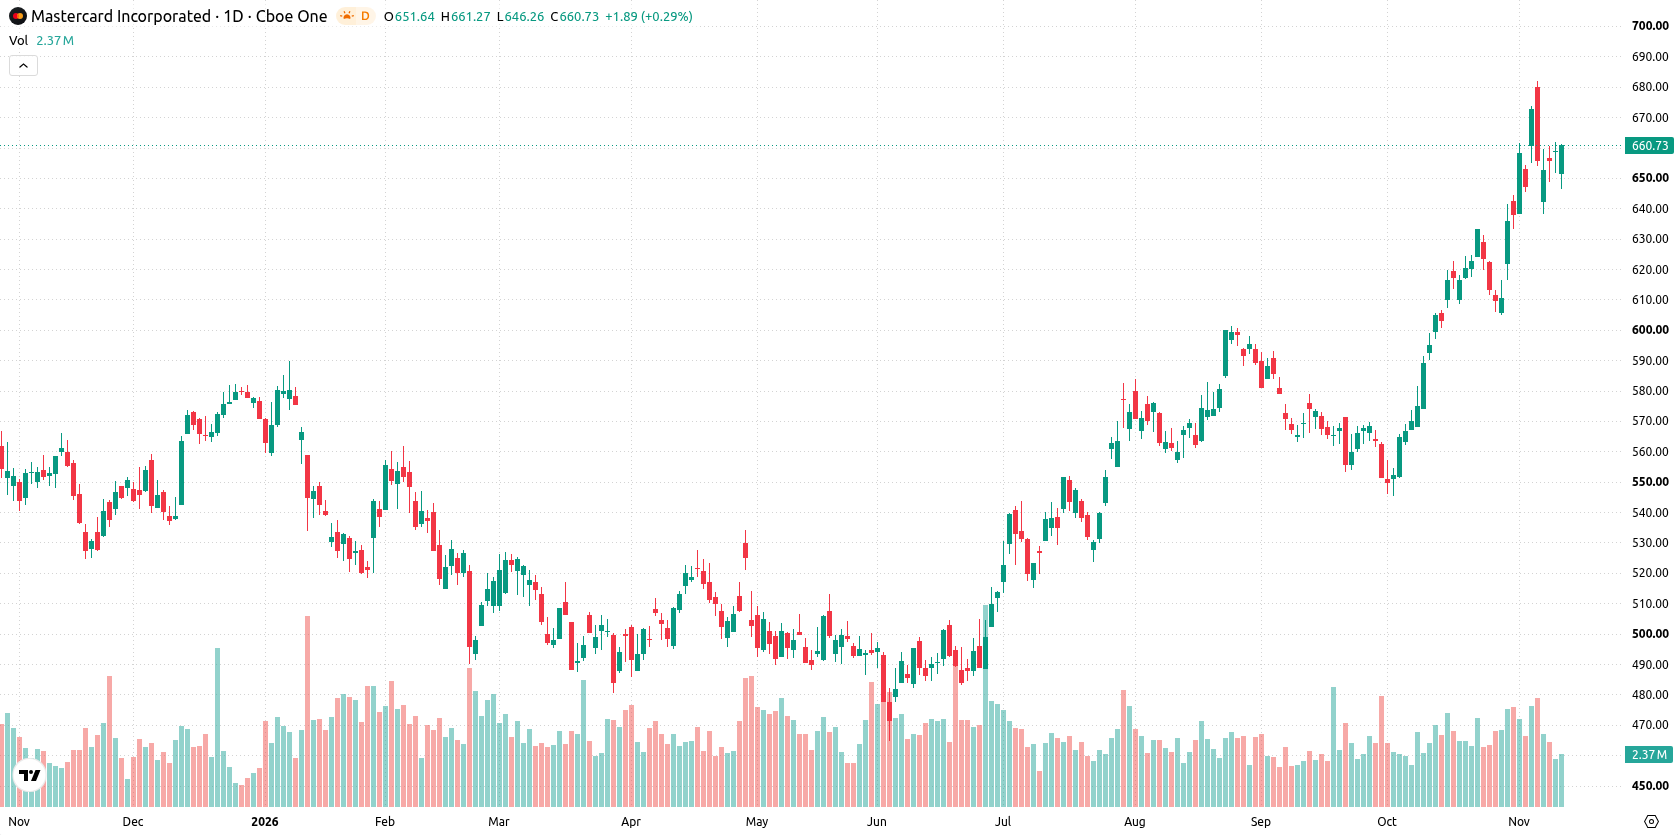
Bullish momentum persists as MACD, ADX confirm trend and volatility steadies
The daily chart shows a sustained move higher with a firm trend, supported by a strong trending setup. MACD and ADX both indicate clear bullish momentum, while daily oscillators such as RSI, CCI, and Stochastic RSI all sit in neutral zones, suggesting stable market conditions despite the 4.08% volatility over the past week. Immediate support is found at $650.04, and resistance stands at $676.57, with the Ichimoku Kijun at $622.84 acting as additional support. On the weekly chart the longer-term picture stays constructive.
Further gains likely as upside breakout risk rises in the coming week
Over the coming trading week, the expected range is $648.64 to $692.25. There is a very high probability (more than 80%) of further gains, and a very low probability (less than 20%) of a decline. The base case calls for consolidation or continuation between $650.04 and $676.57. A sustained push above $676.57 would open room toward the upper edge of the projected range, while a drop below $650.04 could see shares test lower supports with increased correction risk.
Previously it was reported that Mastercard's solid earnings growth and active capital management positioned the stock for continued gains, while technical signals called for caution regarding potential volatility. The latest analysis reinforces this outlook by highlighting persistent bullish momentum and neutral technical readings, with traders advised to monitor $676.57 as the key resistance level for a potential breakout in the near term.






Latest Mastercard News




-
 Afghanistan
-
 Albania
-
 Algeria
-
 Angola
-
 Argentina
-
 Armenia
-
 Australia
-
 Austria
-
 Azerbaijan
-
 Bahamas
-
 Bahrain
-
 Bangladesh
-
 Belarus
-
 Belgium
-
 Bolivia
-
 Botswana
-
 Brazil
-
 Brunei
-
 Bulgaria
-
 Cambodia
-
 Cameroon
-
 Canada
-
 Chile
-
 China
-
 Colombia
-
 Congo
-
 Costa Rica
-
 Cote d'Ivoire
-
 Croatia
-
 Cuba
-
 Cyprus
-
 Czechia
-
 DR Congo
-
 Denmark
-
 Dominican Republic
-
 Ecuador
-
 Egypt
-
 El Salvador
-
 Estonia
-
 Eswatini
-
 Ethiopia
-
 Finland
-
 France
-
 Georgia
-
 Germany
-
 Ghana
-
 Greece
-
 Haiti
-
 Hong Kong
-
 Hungary
-
 India
-
 Indonesia
-
 Iran, Islamic republic
-
 Iraq
-
 Ireland
-
 Israel
-
 Italy
-
 Jamaica
-
 Japan
-
 Jordan
-
 Kazakhstan
-
 Kenya
-
 Korea
-
 Kuwait
-
 Kyrgyzstan
-
 Laos
-
 Latvia
-
 Lebanon
-
 Lesotho
-
 Libya
-
 Lithuania
-
 Luxembourg
-
 Madagascar
-
 Malaysia
-
 Malta
-
 Mauritius
-
 Mexico
-
 Moldova
-
 Mongolia
-
 Montenegro
-
 Morocco
-
 Mozambique
-
 Myanmar
-
 Namibia
-
 Nepal
-
 Netherlands
-
 New Zealand
-
 Nigeria
-
 North Macedonia
-
 Norway
-
 Oman
-
 Pakistan
-
 Palestine
-
 Panama
-
 Papua New Guinea
-
 Paraguay
-
 Peru
-
 Philippines
-
 Poland
-
 Portugal
-
 Puerto Rico
-
 Qatar
-
 Reunion
-
 Romania
-
 Rwanda
-
 Saudi Arabia
-
 Serbia
-
 Singapore
-
 Slovakia
-
 Slovenia
-
 Somalia
-
 South Africa
-
 Spain
-
 Sri Lanka
-
 Sweden
-
 Switzerland
-
 Syria
-
 Taiwan
-
 Tajikistan
-
 Tanzania
-
 Thailand
-
 Trinidad and Tobago
-
 Tunisia
-
 Turkey
-
 UAE
-
 Uganda
-
 Ukraine
-
 United Kingdom
-
United States
-
 Uruguay
-
 Uzbekistan
-
 Venezuela
-
 Vietnam
-
 Yemen
-
 Zambia
-
 Zimbabwe
- Forex
- Crypto












