

Meta Platforms shares technical analysis: Resistance test at $633.68 tempers rebound prospects

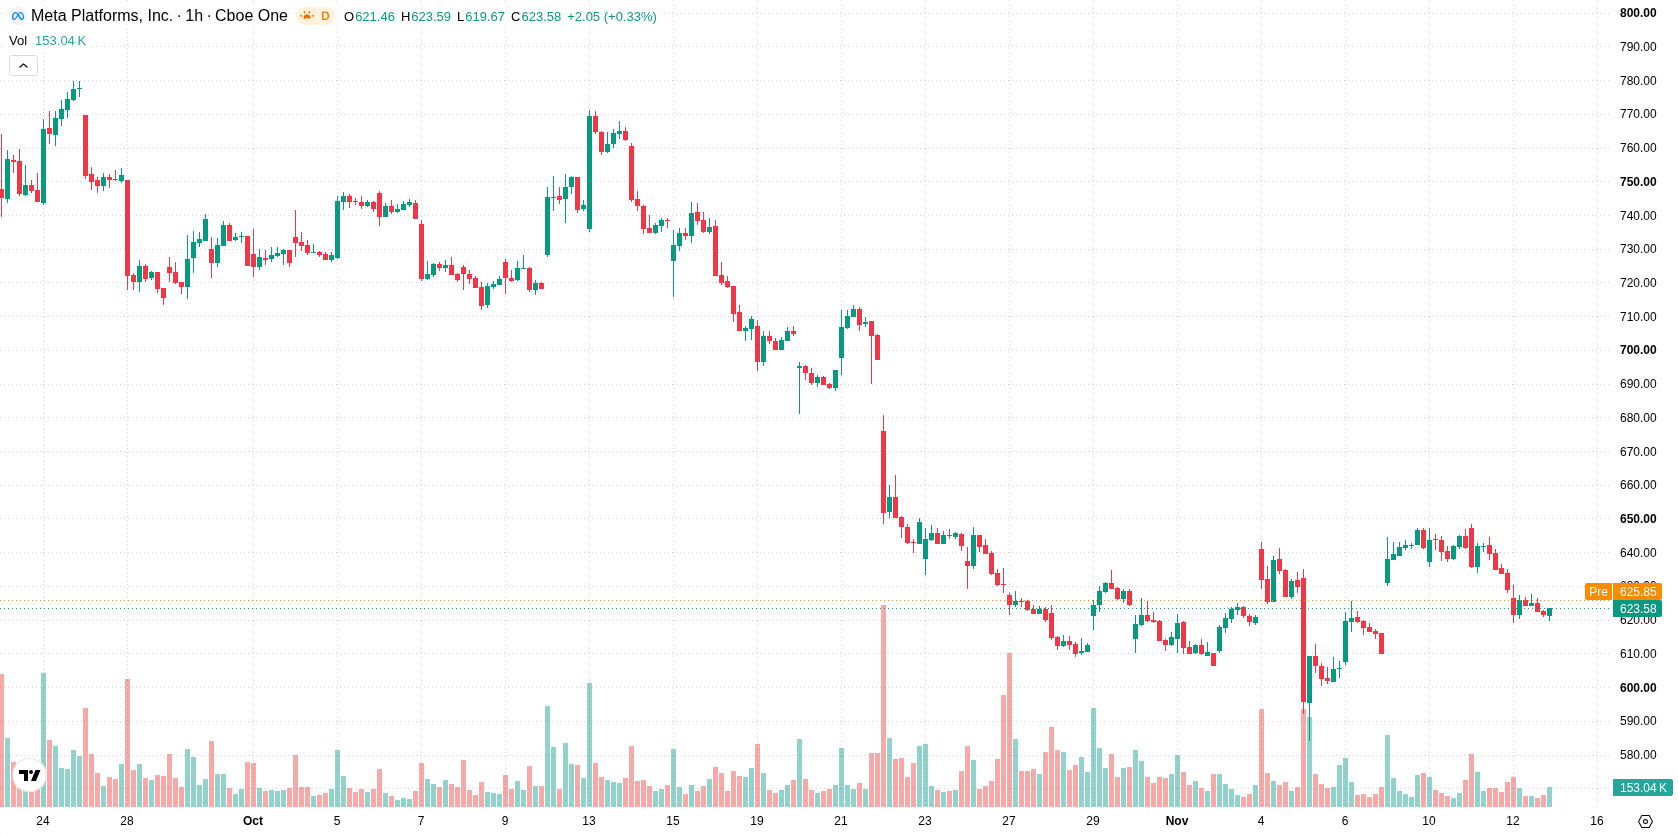
Meta Platforms (META) stock is trading at $624.65, showing a modest decline on the day. The price currently sits below its key moving averages, with intraday action holding around the midpoint of today's range during a period of moderate volatility.
 643.91
647.20
Highlights
- Meta Platforms received a £450,000 fine from the UK regulator for inaccurate data on WhatsApp Business, with short-term compliance cost impact.
- Meta and TikTok contested EU Digital Services Act fees in court, raising uncertainty about future regulatory cost exposure.
- Shares of Meta trade below all key moving averages, with bearish momentum signals and a 73% probability of falling to the $607.47 to $641.83 range.
Regulatory fines and leadership change unsettle market sentiment
Meta Platforms has been fined £450,000 ($597,015) by the UK's communications regulator for providing inaccurate information about its WhatsApp Business service, according to MLex. This action highlights persistent regulatory scrutiny, introducing additional compliance costs and weighing on short-term sentiment for META. On the legal front, both Meta and ByteDance's TikTok challenged the European Commission's Digital Services Act supervisory fees in the EU’s highest court, raising questions about future regulatory exposure, as reported by MLex. Separately, a leadership change saw Meta's infrastructure chief replaced by AWS veteran Dave Brown, and in February 2024, the company initiated a $0.50 per-share quarterly dividend, both providing mixed longer-term context.
Sustained selling pressure as hourly and daily resistance cap price
On the hourly chart, META is trading below both the MA-20 and MA-50, while remaining under the MA-200 on the daily timeframe. The Ichimoku Kijun sits at $633.68, acting as immediate resistance. MACD and ADX display ongoing selling momentum, while intraday readings from Bull/Bear Power also favor sellers. The Awesome Oscillator aligns with this negative intraday bias. Meanwhile, RSI, Stoch RSI, and CCI are all in neutral areas, signaling a lack of pronounced overbought or oversold conditions.
Downside risk prevails as technical boundaries constrain moves
Over the short term, the expected price range spans from $607.47 to $641.83, reflecting typical volatility for META. Price stability within this corridor would point to further consolidation. The downside scenario dominates, with a 73% probability, suggesting any break below $607.47 could trigger accelerated selling. Conversely, a move above the $633.68 resistance would indicate an early bullish reversal.
Previously it was reported that Meta broadened the capabilities of its Muse AI agent by enabling subscriber-initiated outbound calls to U.S. businesses. Against the current backdrop of regulatory challenges, leadership changes, and technical resistance near $633.68, traders should monitor for any decisive breakout above or below the established price range as this could indicate the next meaningful move in META shares.






Latest META News





-
 Afghanistan
-
 Albania
-
 Algeria
-
 Angola
-
 Argentina
-
 Armenia
-
 Australia
-
 Austria
-
 Azerbaijan
-
 Bahamas
-
 Bahrain
-
 Bangladesh
-
 Belarus
-
 Belgium
-
 Bolivia
-
 Botswana
-
 Brazil
-
 Brunei
-
 Bulgaria
-
 Cambodia
-
 Cameroon
-
 Canada
-
 Chile
-
 China
-
 Colombia
-
 Congo
-
 Costa Rica
-
 Cote d'Ivoire
-
 Croatia
-
 Cuba
-
 Cyprus
-
 Czechia
-
 DR Congo
-
 Denmark
-
 Dominican Republic
-
 Ecuador
-
 Egypt
-
 El Salvador
-
 Estonia
-
 Eswatini
-
 Ethiopia
-
 Finland
-
 France
-
 Georgia
-
 Germany
-
 Ghana
-
 Greece
-
 Haiti
-
 Hong Kong
-
 Hungary
-
 India
-
 Indonesia
-
 Iran, Islamic republic
-
 Iraq
-
 Ireland
-
 Israel
-
 Italy
-
 Jamaica
-
 Japan
-
 Jordan
-
 Kazakhstan
-
 Kenya
-
 Korea
-
 Kuwait
-
 Kyrgyzstan
-
 Laos
-
 Latvia
-
 Lebanon
-
 Lesotho
-
 Libya
-
 Lithuania
-
 Luxembourg
-
 Madagascar
-
 Malaysia
-
 Malta
-
 Mauritius
-
 Mexico
-
 Moldova
-
 Mongolia
-
 Montenegro
-
 Morocco
-
 Mozambique
-
 Myanmar
-
 Namibia
-
 Nepal
-
 Netherlands
-
 New Zealand
-
 Nigeria
-
 North Macedonia
-
 Norway
-
 Oman
-
 Pakistan
-
 Palestine
-
 Panama
-
 Papua New Guinea
-
 Paraguay
-
 Peru
-
 Philippines
-
 Poland
-
 Portugal
-
 Puerto Rico
-
 Qatar
-
 Reunion
-
 Romania
-
 Rwanda
-
 Saudi Arabia
-
 Serbia
-
 Singapore
-
 Slovakia
-
 Slovenia
-
 Somalia
-
 South Africa
-
 Spain
-
 Sri Lanka
-
 Sweden
-
 Switzerland
-
 Syria
-
 Taiwan
-
 Tajikistan
-
 Tanzania
-
 Thailand
-
 Trinidad and Tobago
-
 Tunisia
-
 Turkey
-
 UAE
-
 Uganda
-
 Ukraine
-
 United Kingdom
-
United States
-
 Uruguay
-
 Uzbekistan
-
 Venezuela
-
 Vietnam
-
 Yemen
-
 Zambia
-
 Zimbabwe
- Forex
- Crypto












