

Hims & Hers Health stock consolidates as mixed momentum signals persist

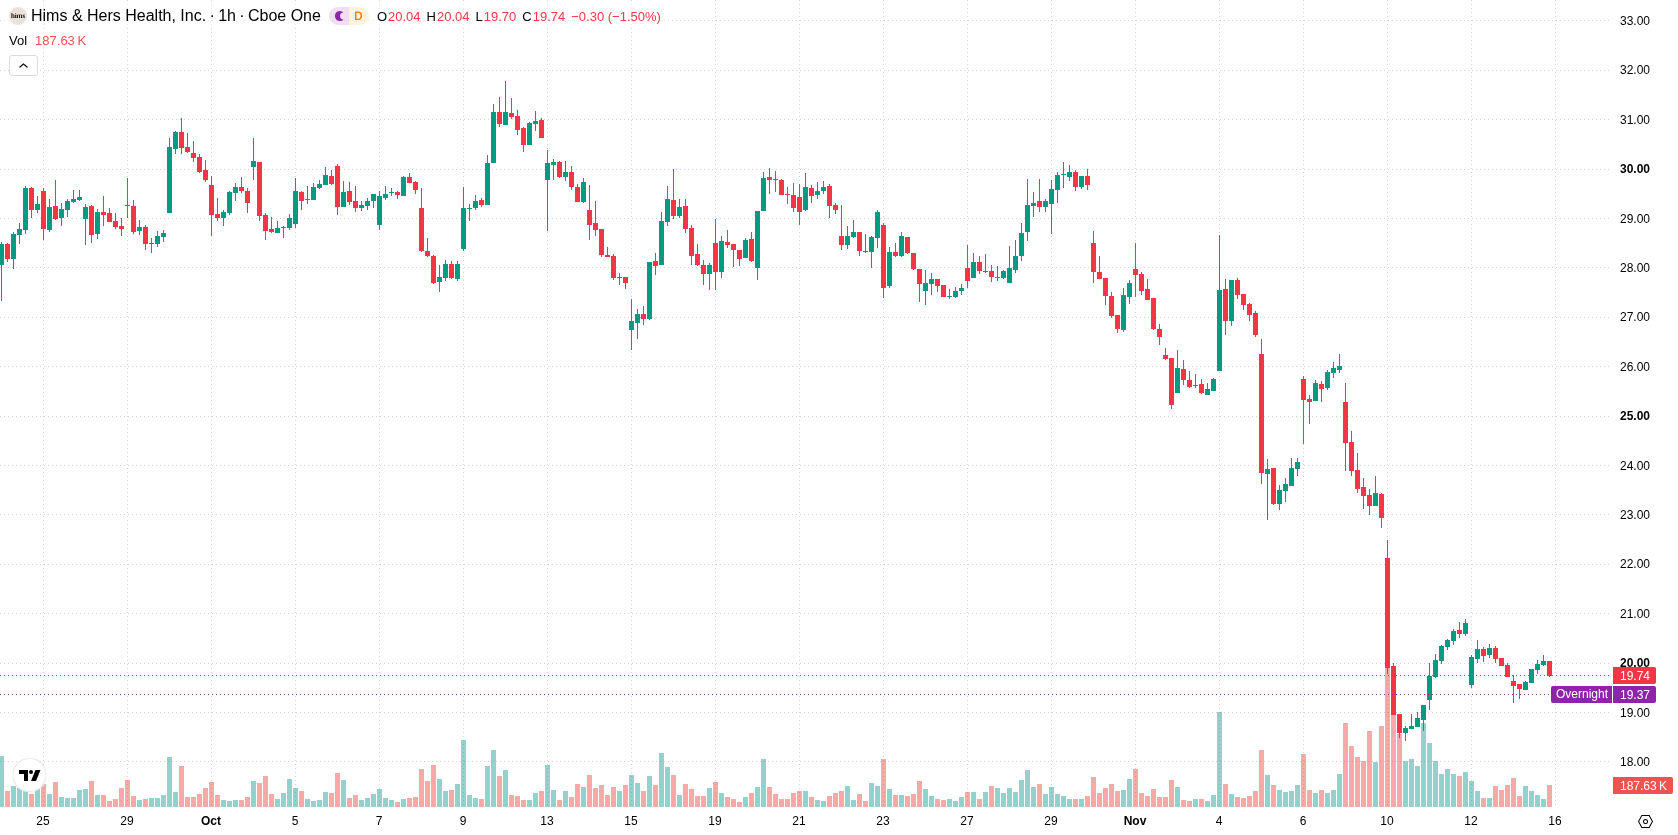
Hims & Hers Health (HIMS) stock is trading at $19.73, unchanged on the day. The price sits below its key moving averages, indicating continued pressure in the current session.
 20.14
25.62
Highlights
- HIMS/USD trades below its short-, medium-, and long-term moving averages, reflecting persistent bearish pressure across all timeframes.
- Momentum indicators such as MACD and ADX register strong sell signals, while oscillators remain neutral with no overbought or oversold conditions.
- Expected trading range over the next 2 to 3 days is $16.51 to $22.95, with low probability of upside and high probability for further declines.
Momentum skewed bearish as support anchors and signals turn mixed
HIMS is currently trading below its MA-20 ($20.09), MA-50 ($21.83), and well under MA-200 ($26.68). The Ichimoku Kijun at $19.65 provides immediate support. Momentum indicators are weighted bearish, with MACD signaling Strong Sell and ADX in Sell mode, underscoring ongoing downside pressure. RSI, Stoch RSI, and CCI remain in the neutral zone without overbought or oversold signals, while Bull/Bear Power is mildly positive at 0.1 and the Awesome Oscillator is neutral. These readings combine to show mixed technical signals, as momentum skews negative but short-term oscillators do not confirm an extreme.
Downside risks elevated as momentum limits bullish scenarios short term
Over the next 2 to 3 trading days, HIMS is expected to trade within the $16.51 to $22.95 band, consistent with recent volatility. The upside probability remains very low, while downside risk is pronounced based on current momentum signals. The baseline scenario calls for sideways movement within this range, with a bullish scenario triggered only by a breakout above resistance; a drop below immediate support would likely prompt further declines toward the lower volatility band.
Earlier, analysts noted that Hims & Hers Health faced persistent downside risk due to ongoing margin pressures and bearish technical trends. The current analysis reinforces this outlook with additional evidence of weak momentum and mixed technical signals, highlighting the importance of monitoring immediate support levels for signs of further downside.






Latest Hims & Hers News








-
 Afghanistan
-
 Albania
-
 Algeria
-
 Angola
-
 Argentina
-
 Armenia
-
 Australia
-
 Austria
-
 Azerbaijan
-
 Bahamas
-
 Bahrain
-
 Bangladesh
-
 Belarus
-
 Belgium
-
 Bolivia
-
 Botswana
-
 Brazil
-
 Brunei
-
 Bulgaria
-
 Cambodia
-
 Cameroon
-
 Canada
-
 Chile
-
 China
-
 Colombia
-
 Congo
-
 Costa Rica
-
 Cote d'Ivoire
-
 Croatia
-
 Cuba
-
 Cyprus
-
 Czechia
-
 DR Congo
-
 Denmark
-
 Dominican Republic
-
 Ecuador
-
 Egypt
-
 El Salvador
-
 Estonia
-
 Eswatini
-
 Ethiopia
-
 Finland
-
 France
-
 Georgia
-
 Germany
-
 Ghana
-
 Greece
-
 Haiti
-
 Hong Kong
-
 Hungary
-
 India
-
 Indonesia
-
 Iran, Islamic republic
-
 Iraq
-
 Ireland
-
 Israel
-
 Italy
-
 Jamaica
-
 Japan
-
 Jordan
-
 Kazakhstan
-
 Kenya
-
 Korea
-
 Kuwait
-
 Kyrgyzstan
-
 Laos
-
 Latvia
-
 Lebanon
-
 Lesotho
-
 Libya
-
 Lithuania
-
 Luxembourg
-
 Madagascar
-
 Malaysia
-
 Malta
-
 Mauritius
-
 Mexico
-
 Moldova
-
 Mongolia
-
 Montenegro
-
 Morocco
-
 Mozambique
-
 Myanmar
-
 Namibia
-
 Nepal
-
 Netherlands
-
 New Zealand
-
 Nigeria
-
 North Macedonia
-
 Norway
-
 Oman
-
 Pakistan
-
 Palestine
-
 Panama
-
 Papua New Guinea
-
 Paraguay
-
 Peru
-
 Philippines
-
 Poland
-
 Portugal
-
 Puerto Rico
-
 Qatar
-
 Reunion
-
 Romania
-
 Rwanda
-
 Saudi Arabia
-
 Serbia
-
 Singapore
-
 Slovakia
-
 Slovenia
-
 Somalia
-
 South Africa
-
 Spain
-
 Sri Lanka
-
 Sweden
-
 Switzerland
-
 Syria
-
 Taiwan
-
 Tajikistan
-
 Tanzania
-
 Thailand
-
 Trinidad and Tobago
-
 Tunisia
-
 Turkey
-
 UAE
-
 Uganda
-
 Ukraine
-
 United Kingdom
-
United States
-
 Uruguay
-
 Uzbekistan
-
 Venezuela
-
 Vietnam
-
 Yemen
-
 Zambia
-
 Zimbabwe
- Forex
- Crypto












