

BT Group stock forecast: Sideways move likely as price holds above long-term support

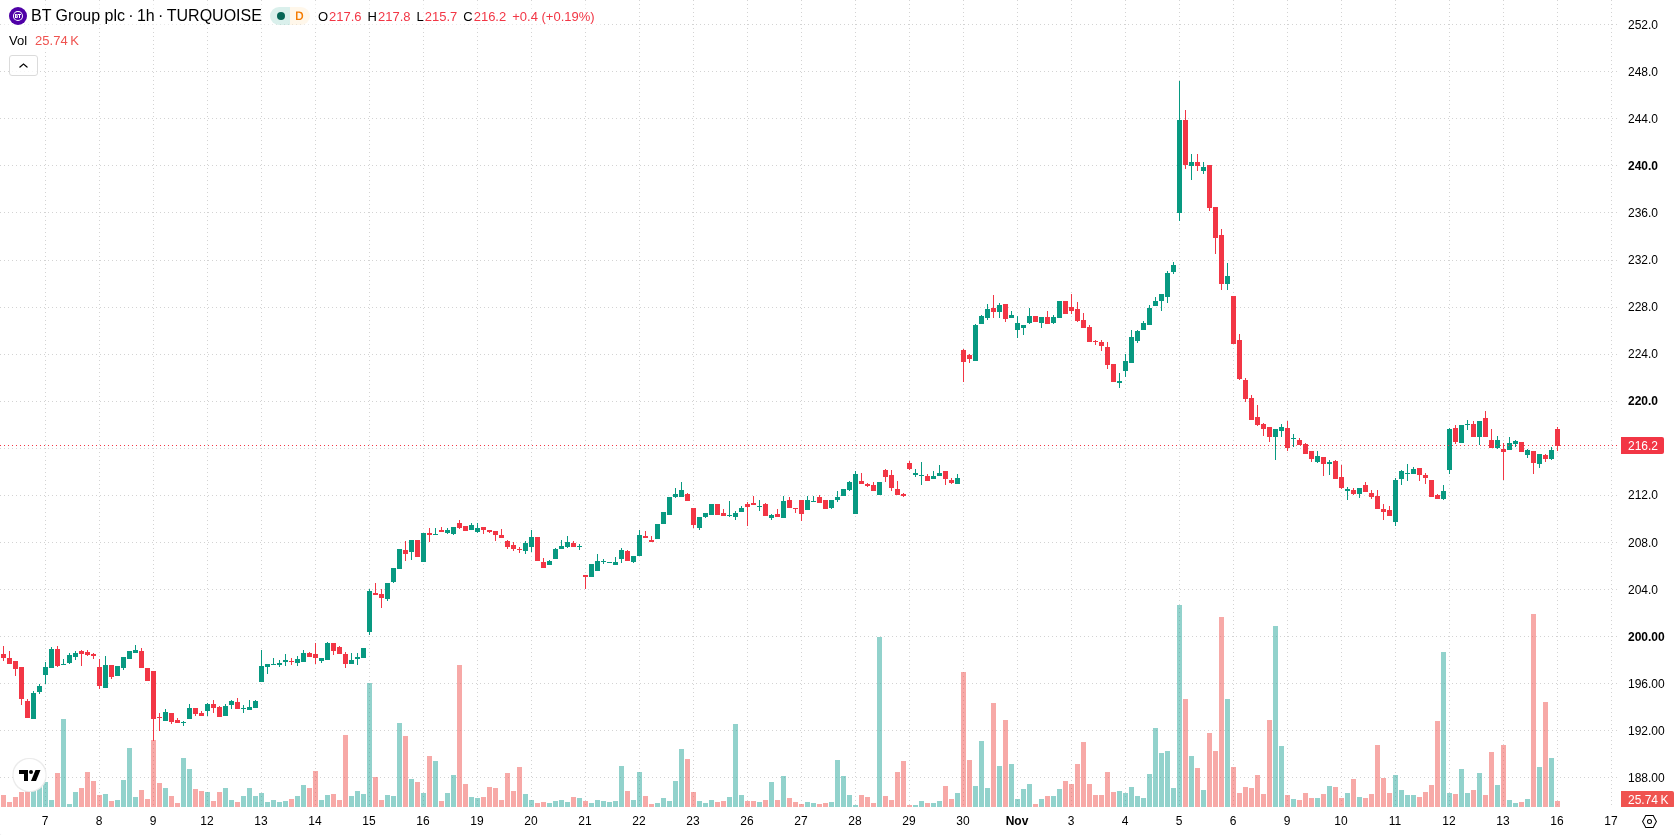
BT Group (BT-A) stock is trading at GBX215.8, showing a modest decline for the day. The stock is currently positioned below its key short-term averages but remains above longer-term support levels.
 218.10
219.30
Highlights
- Shares of BT Group posted a modest decline of 0.37% to GBX215.8 with moderate volatility and intraday resilience.
- Technical signals are mixed, with neutral momentum oscillators and slight intraday buyer pressure countered by a short-term sell bias from ADX.
- Forecasted price range for BT Group in coming days is GBX211.24 to GBX220.36 with an upward move probability of 61%.
Mixed momentum and neutral readings amid marginal buyer presence
On the hourly chart, BT-A is below the MA-20 at GBX216.07 but above both the MA-50 at GBX214.96 and the MA-200 at GBX206.54. The closest identified Ichimoku Kijun support is situated at GBX215.44, serving as a primary technical buffer. Momentum indicators including RSI, Stoch RSI, and CCI all register neutral readings, with no signs of overbought or oversold conditions. MACD holds a neutral stance, while ADX shows a sell bias and Bull/Bear Power at 0.44 highlights marginal intraday buyer presence. Price remains near the upper portion of today's range, pointing to moderate volatility and some degree of resilience, though technical signals appear mixed.
Upward bias within defined range as bullish breakout looms
Over the coming days, GBX211.24 marks the major support and GBX220.36 the likely upper boundary, forming the expected short-term price range. There is a 61% probability of an upward move within this band, versus a 39% chance of a downward break. A baseline expectation would see price consolidate between these levels; a bullish scenario emerges on a sustained break above GBX220.36, while a bearish move could materialize if GBX211.24 is breached.
Earlier, analysts noted that BT Group shares exhibited bullish momentum within a technically constrained range, with key trend signals favoring potential upside. The latest trading now reflects a more balanced technical stance, and traders should monitor the GBX220.36 resistance for signs of renewed directional movement.






Latest BT Group News



-
 Afghanistan
-
 Albania
-
 Algeria
-
 Angola
-
 Argentina
-
 Armenia
-
 Australia
-
 Austria
-
 Azerbaijan
-
 Bahamas
-
 Bahrain
-
 Bangladesh
-
 Belarus
-
 Belgium
-
 Bolivia
-
 Botswana
-
 Brazil
-
 Brunei
-
 Bulgaria
-
 Cambodia
-
 Cameroon
-
 Canada
-
 Chile
-
 China
-
 Colombia
-
 Congo
-
 Costa Rica
-
 Cote d'Ivoire
-
 Croatia
-
 Cuba
-
 Cyprus
-
 Czechia
-
 DR Congo
-
 Denmark
-
 Dominican Republic
-
 Ecuador
-
 Egypt
-
 El Salvador
-
 Estonia
-
 Eswatini
-
 Ethiopia
-
 Finland
-
 France
-
 Georgia
-
 Germany
-
 Ghana
-
 Greece
-
 Haiti
-
 Hong Kong
-
 Hungary
-
 India
-
 Indonesia
-
 Iran, Islamic republic
-
 Iraq
-
 Ireland
-
 Israel
-
 Italy
-
 Jamaica
-
 Japan
-
 Jordan
-
 Kazakhstan
-
 Kenya
-
 Korea
-
 Kuwait
-
 Kyrgyzstan
-
 Laos
-
 Latvia
-
 Lebanon
-
 Lesotho
-
 Libya
-
 Lithuania
-
 Luxembourg
-
 Madagascar
-
 Malaysia
-
 Malta
-
 Mauritius
-
 Mexico
-
 Moldova
-
 Mongolia
-
 Montenegro
-
 Morocco
-
 Mozambique
-
 Myanmar
-
 Namibia
-
 Nepal
-
 Netherlands
-
 New Zealand
-
 Nigeria
-
 North Macedonia
-
 Norway
-
 Oman
-
 Pakistan
-
 Palestine
-
 Panama
-
 Papua New Guinea
-
 Paraguay
-
 Peru
-
 Philippines
-
 Poland
-
 Portugal
-
 Puerto Rico
-
 Qatar
-
 Reunion
-
 Romania
-
 Rwanda
-
 Saudi Arabia
-
 Serbia
-
 Singapore
-
 Slovakia
-
 Slovenia
-
 Somalia
-
 South Africa
-
 Spain
-
 Sri Lanka
-
 Sweden
-
 Switzerland
-
 Syria
-
 Taiwan
-
 Tajikistan
-
 Tanzania
-
 Thailand
-
 Trinidad and Tobago
-
 Tunisia
-
 Turkey
-
 UAE
-
 Uganda
-
 Ukraine
-
 United Kingdom
-
United States
-
 Uruguay
-
 Uzbekistan
-
 Venezuela
-
 Vietnam
-
 Yemen
-
 Zambia
-
 Zimbabwe
- Forex
- Crypto












