

BT-A holds ground as buyers dominate intraday sessions

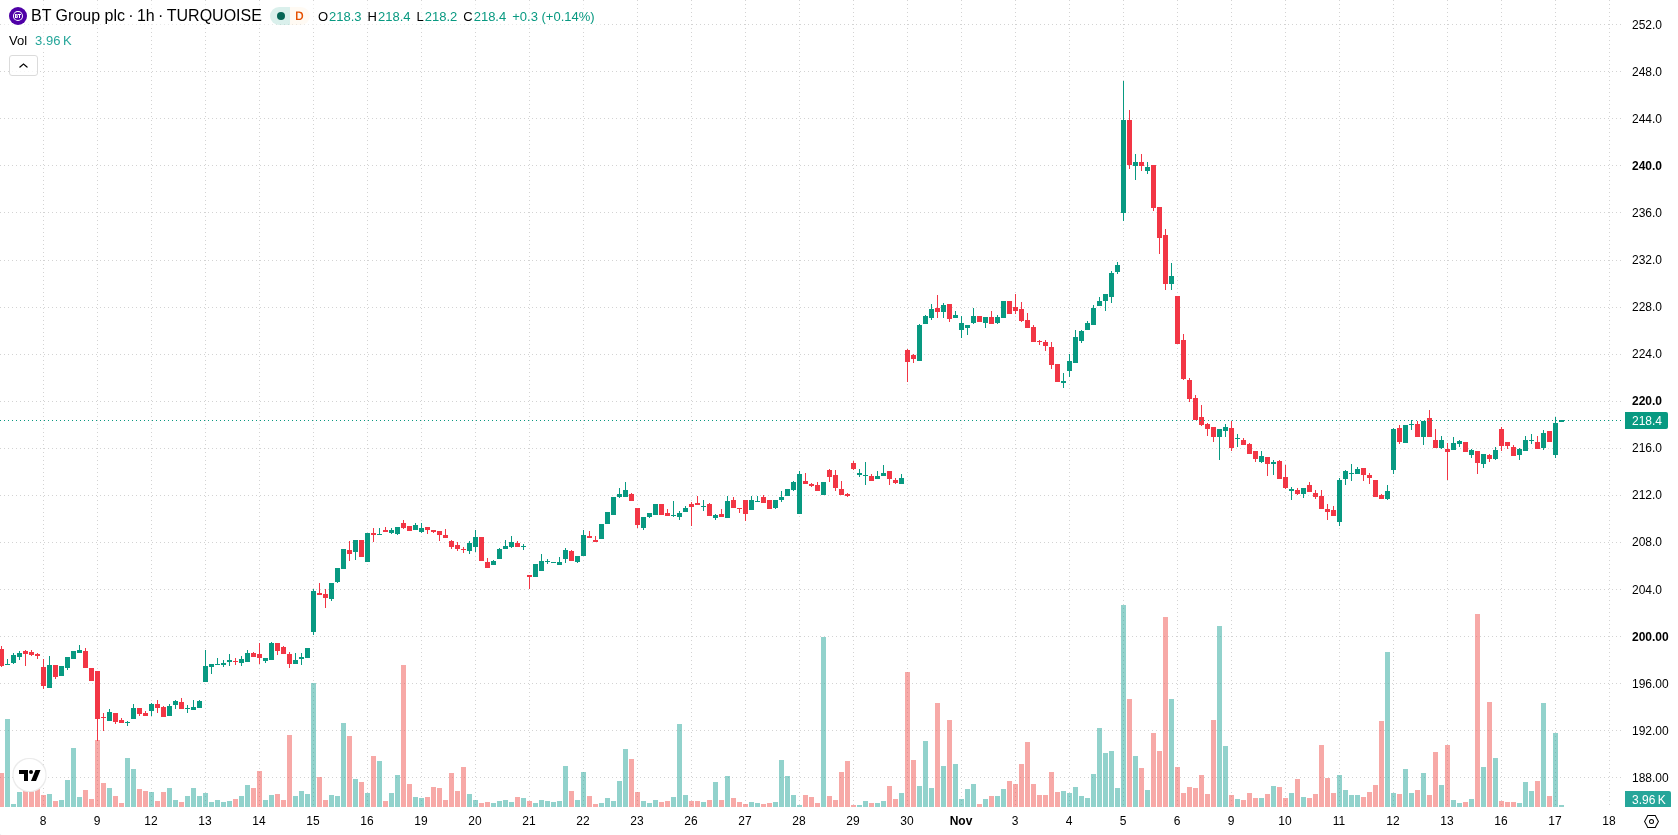
BT Group (BT-A) stock is trading at GBX216.5 after a modest rise today. The price remains positioned above its key short- and long-term moving averages, indicating continued upside momentum in the current session.
 218.10
219.30
Highlights
- BT-A/GBX stock is trading above key moving averages, indicating short- and medium-term upside momentum is intact.
- Indicator signals are mostly neutral, with modest but not directional momentum and no overbought or oversold conditions confirmed.
- The expected price range for the next four trading days is GBX211.94 to GBX221.06, with a 62% probability of an upward move.
Mixed momentum as buyers dominate but direction unclear
On the technical side, BT-A is trading above the H1 SMA-20 at GBX216.08, the H1 SMA-50 at GBX214.83, and the D1 SMA-200 at GBX206.54. The Ichimoku Kijun on the hourly chart is at GBX216.3 and acts as immediate support. MACD signals a buy, while ADX is neutral, indicating that, although momentum exists, it is not strongly directional. RSI, Stochastic RSI, and CCI remain in neutral territory, confirming a lack of any overbought or oversold signals. Bull/Bear Power at 1.07 points to buyer dominance during intraday sessions, and the Awesome Oscillator aligns with this positive short-term outlook. Today's move is near the session low, and volatility is moderate. The combination of these technical readings suggests mixed signals for immediate price movement.
Bullish bias as upside probability exceeds downside risk
Looking ahead, the short-term expected trading range for BT-A over the next four sessions is projected between GBX211.94 and GBX221.06. Statistically, there is a 62% probability of an upside move, with bullish price action more likely than a swing to the downside. In the baseline scenario, the price is likely to oscillate within this volatility band. Should momentum accelerate and the price move above resistance, an extension toward the upper boundary is probable, while a break below support could open the door to a test of the lower end of the range.
Earlier, analysts noted that BT Group shares were exhibiting mixed technical signals within a narrowly defined range, with potential for either upward or downward moves. The latest session adds evidence of strengthening upside momentum, making a break of the projected resistance zone an important technical development to monitor in the coming days.








-
 Afghanistan
-
 Albania
-
 Algeria
-
 Angola
-
 Argentina
-
 Armenia
-
 Australia
-
 Austria
-
 Azerbaijan
-
 Bahamas
-
 Bahrain
-
 Bangladesh
-
 Belarus
-
 Belgium
-
 Bolivia
-
 Botswana
-
 Brazil
-
 Brunei
-
 Bulgaria
-
 Cambodia
-
 Cameroon
-
 Canada
-
 Chile
-
 China
-
 Colombia
-
 Congo
-
 Costa Rica
-
 Cote d'Ivoire
-
 Croatia
-
 Cuba
-
 Cyprus
-
 Czechia
-
 DR Congo
-
 Denmark
-
 Dominican Republic
-
 Ecuador
-
 Egypt
-
 El Salvador
-
 Estonia
-
 Eswatini
-
 Ethiopia
-
 Finland
-
 France
-
 Georgia
-
 Germany
-
 Ghana
-
 Greece
-
 Haiti
-
 Hong Kong
-
 Hungary
-
 India
-
 Indonesia
-
 Iran, Islamic republic
-
 Iraq
-
 Ireland
-
 Israel
-
 Italy
-
 Jamaica
-
 Japan
-
 Jordan
-
 Kazakhstan
-
 Kenya
-
 Korea
-
 Kuwait
-
 Kyrgyzstan
-
 Laos
-
 Latvia
-
 Lebanon
-
 Lesotho
-
 Libya
-
 Lithuania
-
 Luxembourg
-
 Madagascar
-
 Malaysia
-
 Malta
-
 Mauritius
-
 Mexico
-
 Moldova
-
 Mongolia
-
 Montenegro
-
 Morocco
-
 Mozambique
-
 Myanmar
-
 Namibia
-
 Nepal
-
 Netherlands
-
 New Zealand
-
 Nigeria
-
 North Macedonia
-
 Norway
-
 Oman
-
 Pakistan
-
 Palestine
-
 Panama
-
 Papua New Guinea
-
 Paraguay
-
 Peru
-
 Philippines
-
 Poland
-
 Portugal
-
 Puerto Rico
-
 Qatar
-
 Reunion
-
 Romania
-
 Rwanda
-
 Saudi Arabia
-
 Serbia
-
 Singapore
-
 Slovakia
-
 Slovenia
-
 Somalia
-
 South Africa
-
 Spain
-
 Sri Lanka
-
 Sweden
-
 Switzerland
-
 Syria
-
 Taiwan
-
 Tajikistan
-
 Tanzania
-
 Thailand
-
 Trinidad and Tobago
-
 Tunisia
-
 Turkey
-
 UAE
-
 Uganda
-
 Ukraine
-
 United Kingdom
-
United States
-
 Uruguay
-
 Uzbekistan
-
 Venezuela
-
 Vietnam
-
 Yemen
-
 Zambia
-
 Zimbabwe
- Forex
- Crypto












