

Texas Instruments stock extends lower as weak momentum defines current session

Texas Instruments (TXN) stock is trading at $293.91, down 3.19% on the day. The decline places the price below its short- and medium-term moving averages, while the longer-term trend retains some support.
 296.22
316.91
Highlights
- Texas Instruments increased earnings as data center and industrial sales expanded its main business segments this year.
- The stock's fundamentals remain supported by strong performance in key segments despite ongoing sector changes.
- Shares declined 3.19% to $293.91 and are expected to trade between $282.25 and $308.26 with short- and medium-term bearish pressure prevailing despite neutral indicators.
Earnings strength offset by persistent sector-driven selling
Texas Instruments has recorded substantial growth in its data center and industrial sales this year, a trend which has directly expanded its key business segments and boosted realized earnings, according to 24/7 Wall St. The robust performance in these areas has provided foundational support for the company’s stock as it navigates sector shifts. Despite these positive results underpinning the company’s fundamentals, price action has remained under broader selling pressure.
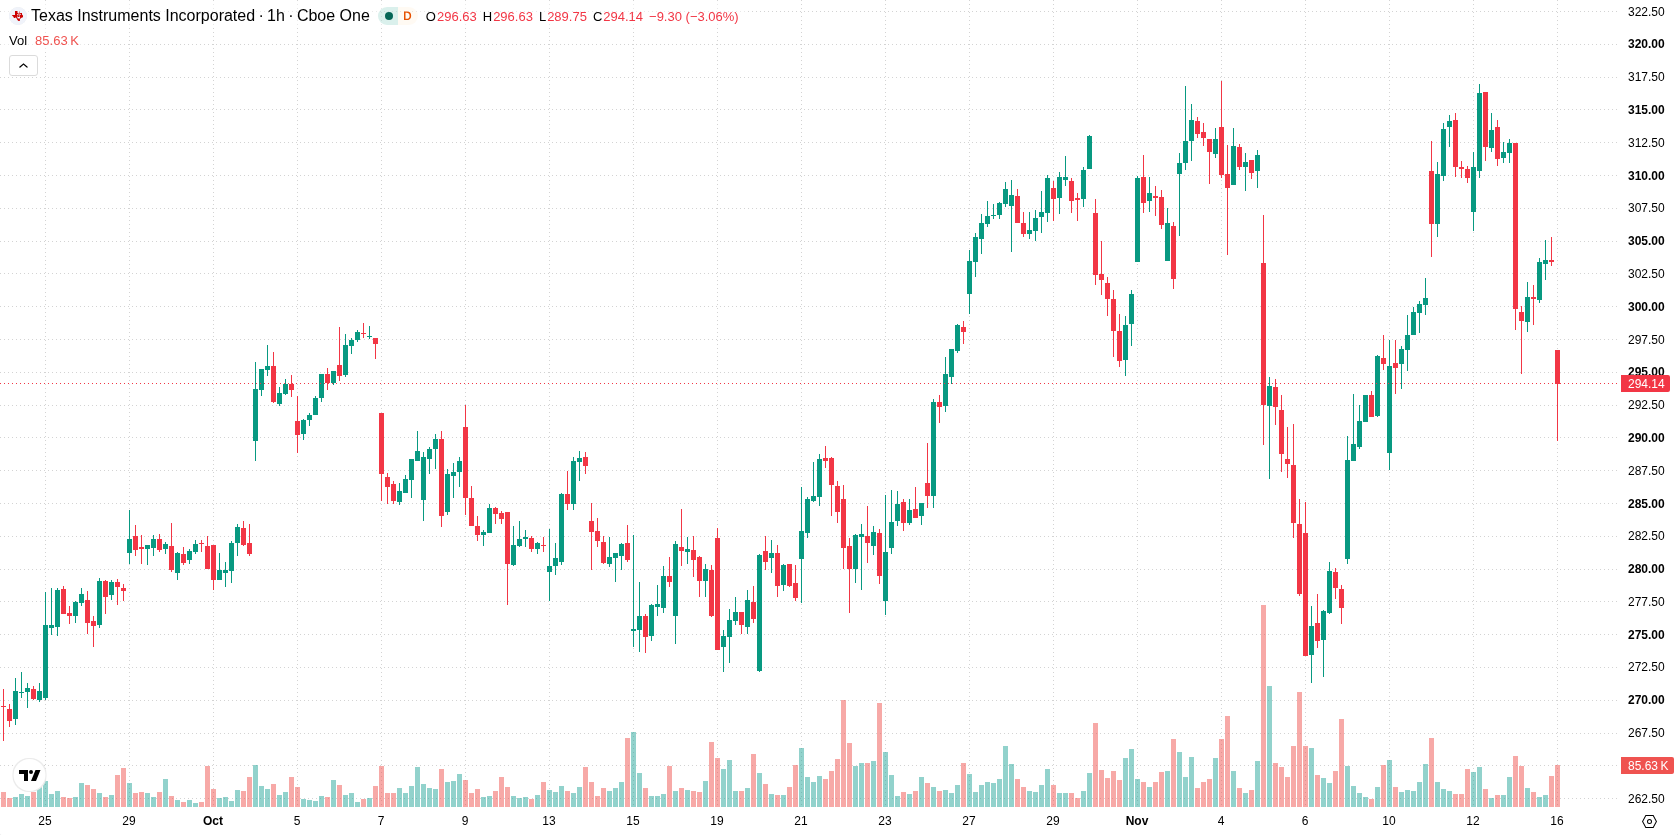
Long-term support holds as intraday momentum indicators remain neutral
On the hourly chart, TXN is positioned below both the MA-20 and MA-50, while remaining above the MA-200 on the daily timeframe, highlighting the presence of longer-term support at lower levels. The Ichimoku Kijun sits at $305.86 and serves as immediate resistance for upward moves. MACD, ADX, and the Awesome Oscillator remain neutral, joined by RSI and CCI, which both sit in the neutral range and suggest no extreme momentum. Stochastic RSI has entered the oversold zone, providing a possible signal for short-term rebound, while persistently negative Bull/Bear Power underscores continued seller dominance in intraday action.
Rangebound outlook as upward breakout probability stays limited
Over the coming sessions, TXN is expected to remain rangebound between $282.25 and $308.26, reflecting typical volatility for the stock at current levels. The probability of an upward breakout is assessed at 26%, suggesting that a move lower is more likely if recent support is lost. A bullish scenario would require price action to clear resistance at $305.86, which could open the way for higher short-term targets. Conversely, a break below $282.25 would threaten additional downside momentum if that support fails.
Earlier, analysts noted that Texas Instruments was exhibiting robust long-term bullish momentum, supported by persistent institutional accumulation despite short-term selling pressures. The current analysis underscores a shift in technical posture, with the stock now positioned below key short- and medium-term averages, making the $282.25 support level critical to watch for any escalation in downside risk.






Latest Texas Instruments News




-
 Afghanistan
-
 Albania
-
 Algeria
-
 Angola
-
 Argentina
-
 Armenia
-
 Australia
-
 Austria
-
 Azerbaijan
-
 Bahamas
-
 Bahrain
-
 Bangladesh
-
 Belarus
-
 Belgium
-
 Bolivia
-
 Botswana
-
 Brazil
-
 Brunei
-
 Bulgaria
-
 Cambodia
-
 Cameroon
-
 Canada
-
 Chile
-
 China
-
 Colombia
-
 Congo
-
 Costa Rica
-
 Cote d'Ivoire
-
 Croatia
-
 Cuba
-
 Cyprus
-
 Czechia
-
 DR Congo
-
 Denmark
-
 Dominican Republic
-
 Ecuador
-
 Egypt
-
 El Salvador
-
 Estonia
-
 Eswatini
-
 Ethiopia
-
 Finland
-
 France
-
 Georgia
-
 Germany
-
 Ghana
-
 Greece
-
 Haiti
-
 Hong Kong
-
 Hungary
-
 India
-
 Indonesia
-
 Iran, Islamic republic
-
 Iraq
-
 Ireland
-
 Israel
-
 Italy
-
 Jamaica
-
 Japan
-
 Jordan
-
 Kazakhstan
-
 Kenya
-
 Korea
-
 Kuwait
-
 Kyrgyzstan
-
 Laos
-
 Latvia
-
 Lebanon
-
 Lesotho
-
 Libya
-
 Lithuania
-
 Luxembourg
-
 Madagascar
-
 Malaysia
-
 Malta
-
 Mauritius
-
 Mexico
-
 Moldova
-
 Mongolia
-
 Montenegro
-
 Morocco
-
 Mozambique
-
 Myanmar
-
 Namibia
-
 Nepal
-
 Netherlands
-
 New Zealand
-
 Nigeria
-
 North Macedonia
-
 Norway
-
 Oman
-
 Pakistan
-
 Palestine
-
 Panama
-
 Papua New Guinea
-
 Paraguay
-
 Peru
-
 Philippines
-
 Poland
-
 Portugal
-
 Puerto Rico
-
 Qatar
-
 Reunion
-
 Romania
-
 Rwanda
-
 Saudi Arabia
-
 Serbia
-
 Singapore
-
 Slovakia
-
 Slovenia
-
 Somalia
-
 South Africa
-
 Spain
-
 Sri Lanka
-
 Sweden
-
 Switzerland
-
 Syria
-
 Taiwan
-
 Tajikistan
-
 Tanzania
-
 Thailand
-
 Trinidad and Tobago
-
 Tunisia
-
 Turkey
-
 UAE
-
 Uganda
-
 Ukraine
-
 United Kingdom
-
United States
-
 Uruguay
-
 Uzbekistan
-
 Venezuela
-
 Vietnam
-
 Yemen
-
 Zambia
-
 Zimbabwe
- Forex
- Crypto












