


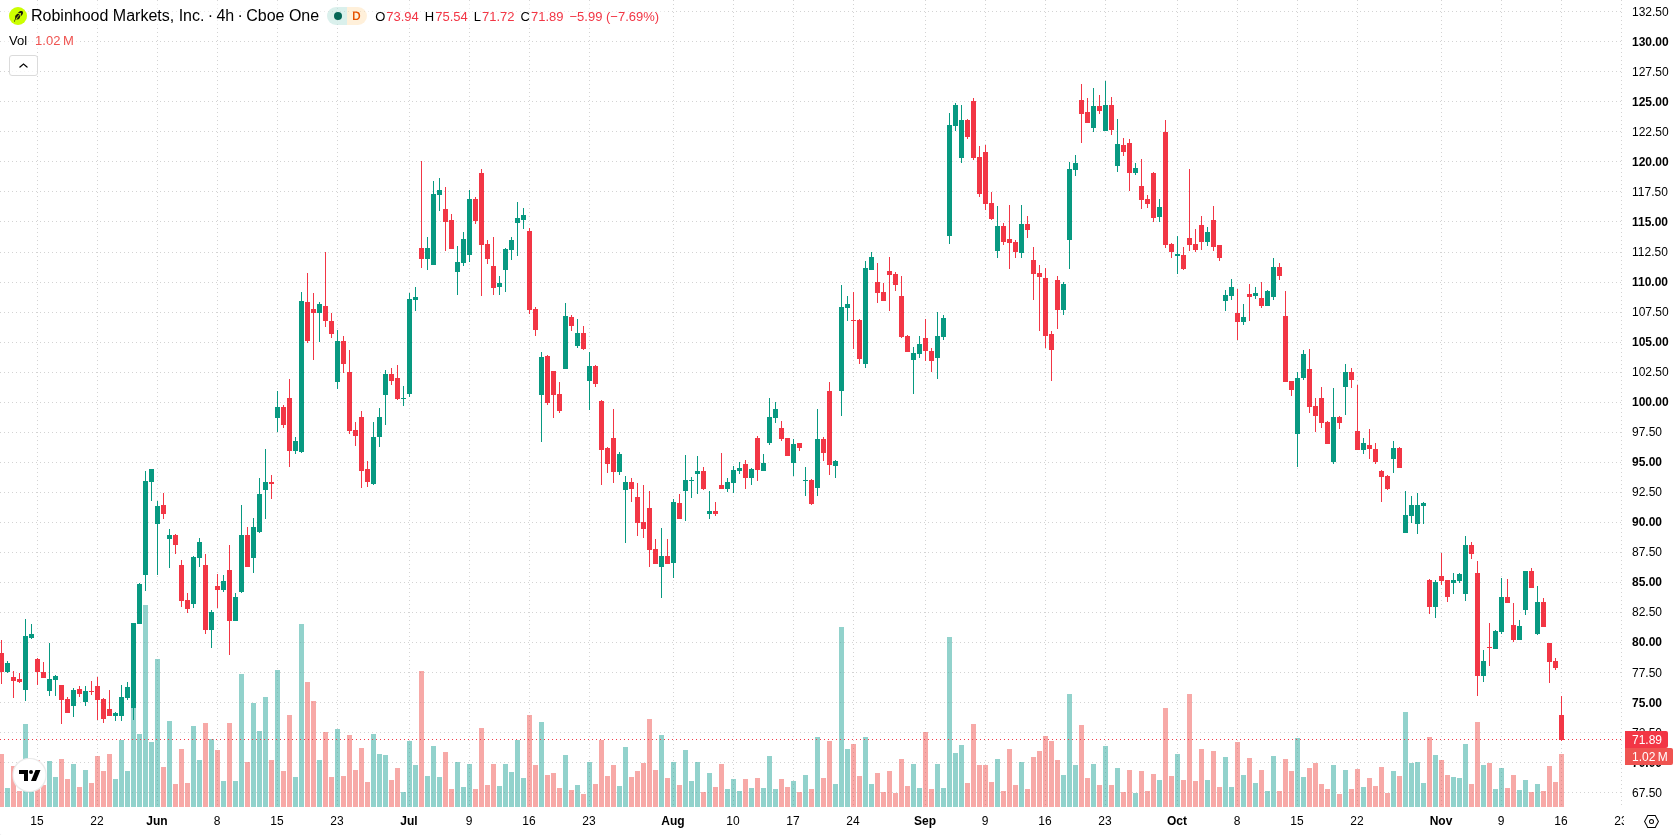
Robinhood Markets Inc (HOOD) fell 7.37% as a steep drop in crypto trading revenue and continued weakness in cryptocurrency prices pressured sentiment. The decline is supported by persistent bearish momentum, with Robinhood trading below all its major moving averages and sellers dominating across trend horizons.
 75.44
86.09
Highlights
- Shares of Robinhood fell under selling pressure following a 55% drop in crypto trading revenue last quarter.
- Third-quarter results showed $1.4 billion in revenue, $16 billion in net deposits, and 5.2 million Gold subscribers during a slowdown in crypto trading.
- Robinhood stock trades below key technical levels with a projected five-day range of $67.24 to $76.67 and strong bearish signals from momentum indicators.
Trading revenue slides as broad sell-off erodes earnings outlook
Robinhood was impacted by a broader market sell-off and a decline in cryptocurrency prices. The company reported a 55% decrease in crypto trading revenue in the previous quarter, with Bitcoin's continued slide pressuring earnings. Recent reports recorded third-quarter revenue of $1.4 billion, net deposits of $16 billion, and 5.2 million Robinhood Gold subscribers, accompanied by reduced crypto trading activity, though price action has remained under broader selling pressure.
Multiple bearish signals reinforce downside momentum at key support
Robinhood is currently trading below its 20-day, 50-day, and 200-day moving averages ($88.41, $103.24, and $91.41 respectively), reflecting dominant pressure from sellers across all trend horizons. The near-term ceiling stands at $75.44, while immediate support is at $71.78. Longer-term moving averages and the Ichimoku Kijun at $93.7 confirm the prevailing bearish environment. Momentum indicators maintain a bearish tone, with both MACD and Average Directional Index signaling downside pressure. The Relative Strength Index is neutral, Commodity Channel Index is in its oversold zone, and Stochastic RSI is also neutral. Bull/Bear Power shows sellers dominating intraday action, reinforced by a negative daily move. An opening downside gap and intraday volatility of 5.10% further illustrate persistent downside pressure after the open.
Earlier, analysts noted that Robinhood was experiencing persistent technical weakness and ongoing selling pressure despite operational progress. Current price action and a sharp drop in crypto trading revenue reinforce this bearish outlook, with a key downside risk emerging if support at $71.78 fails to hold.










-
 Afghanistan
-
 Albania
-
 Algeria
-
 Angola
-
 Argentina
-
 Armenia
-
 Australia
-
 Austria
-
 Azerbaijan
-
 Bahamas
-
 Bahrain
-
 Bangladesh
-
 Belarus
-
 Belgium
-
 Bolivia
-
 Botswana
-
 Brazil
-
 Brunei
-
 Bulgaria
-
 Cambodia
-
 Cameroon
-
 Canada
-
 Chile
-
 China
-
 Colombia
-
 Congo
-
 Costa Rica
-
 Cote d'Ivoire
-
 Croatia
-
 Cuba
-
 Cyprus
-
 Czechia
-
 DR Congo
-
 Denmark
-
 Dominican Republic
-
 Ecuador
-
 Egypt
-
 El Salvador
-
 Estonia
-
 Eswatini
-
 Ethiopia
-
 Finland
-
 France
-
 Georgia
-
 Germany
-
 Ghana
-
 Greece
-
 Haiti
-
 Hong Kong
-
 Hungary
-
 India
-
 Indonesia
-
 Iran, Islamic republic
-
 Iraq
-
 Ireland
-
 Israel
-
 Italy
-
 Jamaica
-
 Japan
-
 Jordan
-
 Kazakhstan
-
 Kenya
-
 Korea
-
 Kuwait
-
 Kyrgyzstan
-
 Laos
-
 Latvia
-
 Lebanon
-
 Lesotho
-
 Libya
-
 Lithuania
-
 Luxembourg
-
 Madagascar
-
 Malaysia
-
 Malta
-
 Mauritius
-
 Mexico
-
 Moldova
-
 Mongolia
-
 Montenegro
-
 Morocco
-
 Mozambique
-
 Myanmar
-
 Namibia
-
 Nepal
-
 Netherlands
-
 New Zealand
-
 Nigeria
-
 North Macedonia
-
 Norway
-
 Oman
-
 Pakistan
-
 Palestine
-
 Panama
-
 Papua New Guinea
-
 Paraguay
-
 Peru
-
 Philippines
-
 Poland
-
 Portugal
-
 Puerto Rico
-
 Qatar
-
 Reunion
-
 Romania
-
 Rwanda
-
 Saudi Arabia
-
 Serbia
-
 Singapore
-
 Slovakia
-
 Slovenia
-
 Somalia
-
 South Africa
-
 Spain
-
 Sri Lanka
-
 Sweden
-
 Switzerland
-
 Syria
-
 Taiwan
-
 Tajikistan
-
 Tanzania
-
 Thailand
-
 Trinidad and Tobago
-
 Tunisia
-
 Turkey
-
 UAE
-
 Uganda
-
 Ukraine
-
 United Kingdom
-
United States
-
 Uruguay
-
 Uzbekistan
-
 Venezuela
-
 Vietnam
-
 Yemen
-
 Zambia
-
 Zimbabwe
- Forex
- Crypto












