

What's behind National Grid's latest stock pullback?

Downside momentum dominated National Grid plc (NG) as the stock fell 1.56% after opening with a downside gap, with selling pressure outweighing any fresh catalyst. The decline is somewhat at odds with a broadly bullish technical framework, as the price remains above its short-, medium-, and long-term moving averages.
 1274.50
1284.50
Highlights
- Shares of National Grid trade above key moving averages, showing a bullish structure across short- and long-term timeframes.
- Technical momentum readings are mostly supportive but overbought conditions suggest potential for a short-term pause or correction.
- The expected price range for the next five trading days is GBX1,238 to GBX1,291, with key support at GBX1,246 and resistance at GBX1,270.
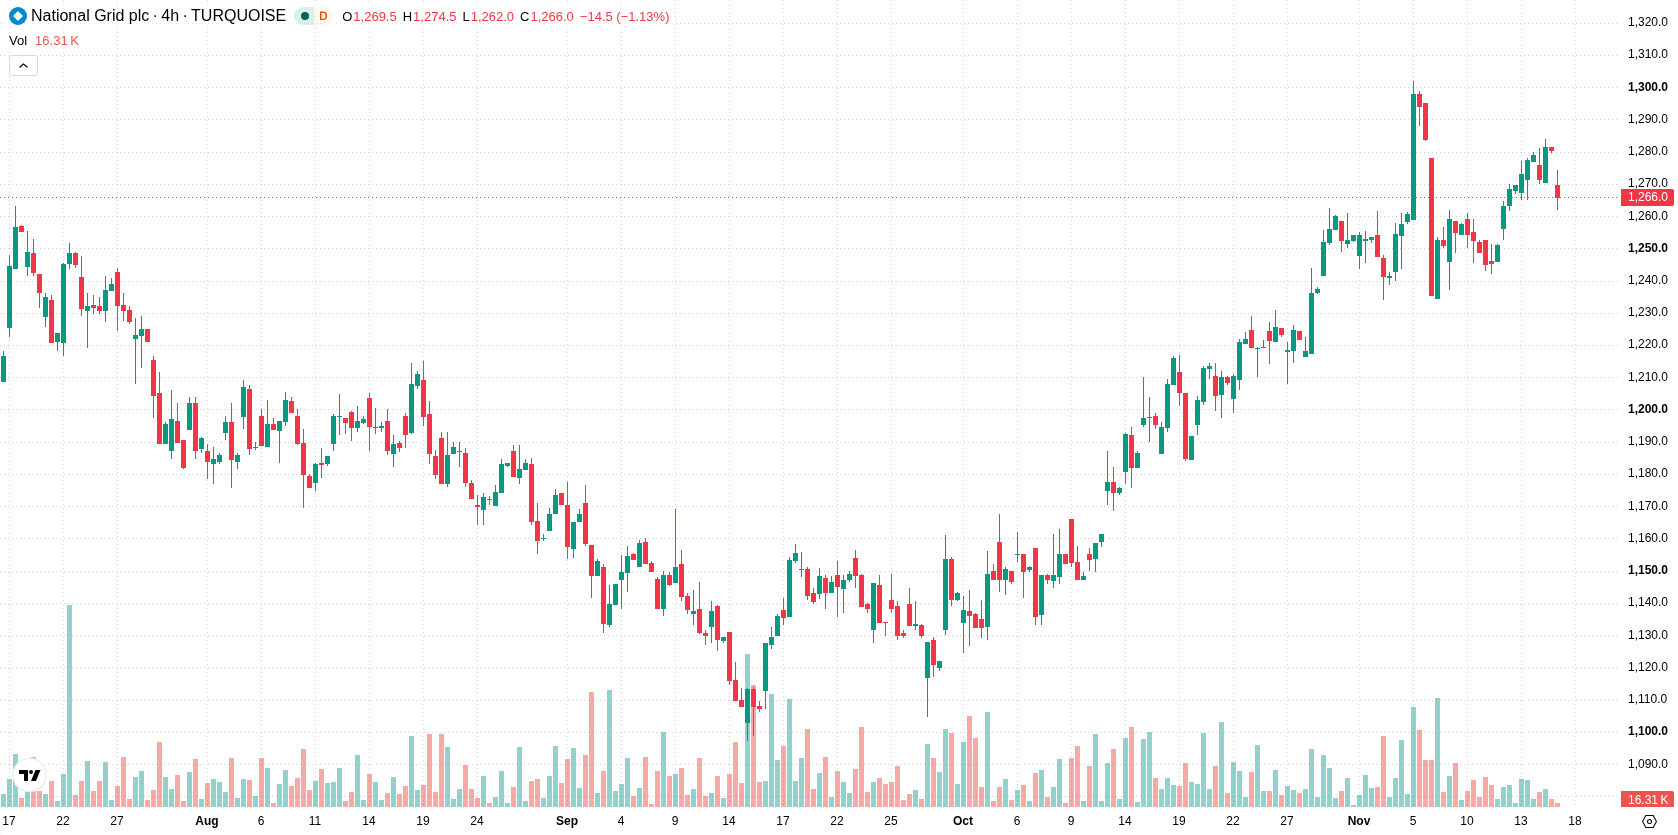
Mixed momentum persists as resistance near, despite trend support
National Grid is trading above its 20-day, 50-day, and 200-day moving averages (GBX1,246, GBX1,187, and GBX1,240 respectively), supporting a bullish short-, medium-, and long-term trend structure. The nearest resistance is at GBX1,270, with support at GBX1,246. Longer-term alignment between the 50-day and 200-day averages is bearish, signaling less strength in the underlying trend backdrop. Momentum indicators are broadly supportive: the MACD and Average Directional Index indicate ongoing upward momentum. The RSI is neutral, just under the overbought threshold, Stochastic RSI is also neutral, while the CCI is in the overbought zone, suggesting possible short-term pause or minor correction. Bull/Bear Power is positive, indicating buyers dominate intraday momentum. Price action is near today's low, and volatility is elevated at 1.14%, pointing to renewed downside pressure after the open, contrasting with the prevailing strength in momentum readings and overbought CCI.
Earlier, analysts noted that National Grid's technical strength was underpinned by substantial capital investment and balanced momentum readings, supporting a scenario of measured, rangebound growth. The current emergence of downside pressure despite ongoing momentum underscores the importance of monitoring the GBX1,246 support level for any decisive shifts in the prevailing trend.











-
 Afghanistan
-
 Albania
-
 Algeria
-
 Angola
-
 Argentina
-
 Armenia
-
 Australia
-
 Austria
-
 Azerbaijan
-
 Bahamas
-
 Bahrain
-
 Bangladesh
-
 Belarus
-
 Belgium
-
 Bolivia
-
 Botswana
-
 Brazil
-
 Brunei
-
 Bulgaria
-
 Cambodia
-
 Cameroon
-
 Canada
-
 Chile
-
 China
-
 Colombia
-
 Congo
-
 Costa Rica
-
 Cote d'Ivoire
-
 Croatia
-
 Cuba
-
 Cyprus
-
 Czechia
-
 DR Congo
-
 Denmark
-
 Dominican Republic
-
 Ecuador
-
 Egypt
-
 El Salvador
-
 Estonia
-
 Eswatini
-
 Ethiopia
-
 Finland
-
 France
-
 Georgia
-
 Germany
-
 Ghana
-
 Greece
-
 Haiti
-
 Hong Kong
-
 Hungary
-
 India
-
 Indonesia
-
 Iran, Islamic republic
-
 Iraq
-
 Ireland
-
 Israel
-
 Italy
-
 Jamaica
-
 Japan
-
 Jordan
-
 Kazakhstan
-
 Kenya
-
 Korea
-
 Kuwait
-
 Kyrgyzstan
-
 Laos
-
 Latvia
-
 Lebanon
-
 Lesotho
-
 Libya
-
 Lithuania
-
 Luxembourg
-
 Madagascar
-
 Malaysia
-
 Malta
-
 Mauritius
-
 Mexico
-
 Moldova
-
 Mongolia
-
 Montenegro
-
 Morocco
-
 Mozambique
-
 Myanmar
-
 Namibia
-
 Nepal
-
 Netherlands
-
 New Zealand
-
 Nigeria
-
 North Macedonia
-
 Norway
-
 Oman
-
 Pakistan
-
 Palestine
-
 Panama
-
 Papua New Guinea
-
 Paraguay
-
 Peru
-
 Philippines
-
 Poland
-
 Portugal
-
 Puerto Rico
-
 Qatar
-
 Reunion
-
 Romania
-
 Rwanda
-
 Saudi Arabia
-
 Serbia
-
 Singapore
-
 Slovakia
-
 Slovenia
-
 Somalia
-
 South Africa
-
 Spain
-
 Sri Lanka
-
 Sweden
-
 Switzerland
-
 Syria
-
 Taiwan
-
 Tajikistan
-
 Tanzania
-
 Thailand
-
 Trinidad and Tobago
-
 Tunisia
-
 Turkey
-
 UAE
-
 Uganda
-
 Ukraine
-
 United Kingdom
-
United States
-
 Uruguay
-
 Uzbekistan
-
 Venezuela
-
 Vietnam
-
 Yemen
-
 Zambia
-
 Zimbabwe
- Forex
- Crypto












