

SNDL drops as weak momentum keeps seller pressure in focus

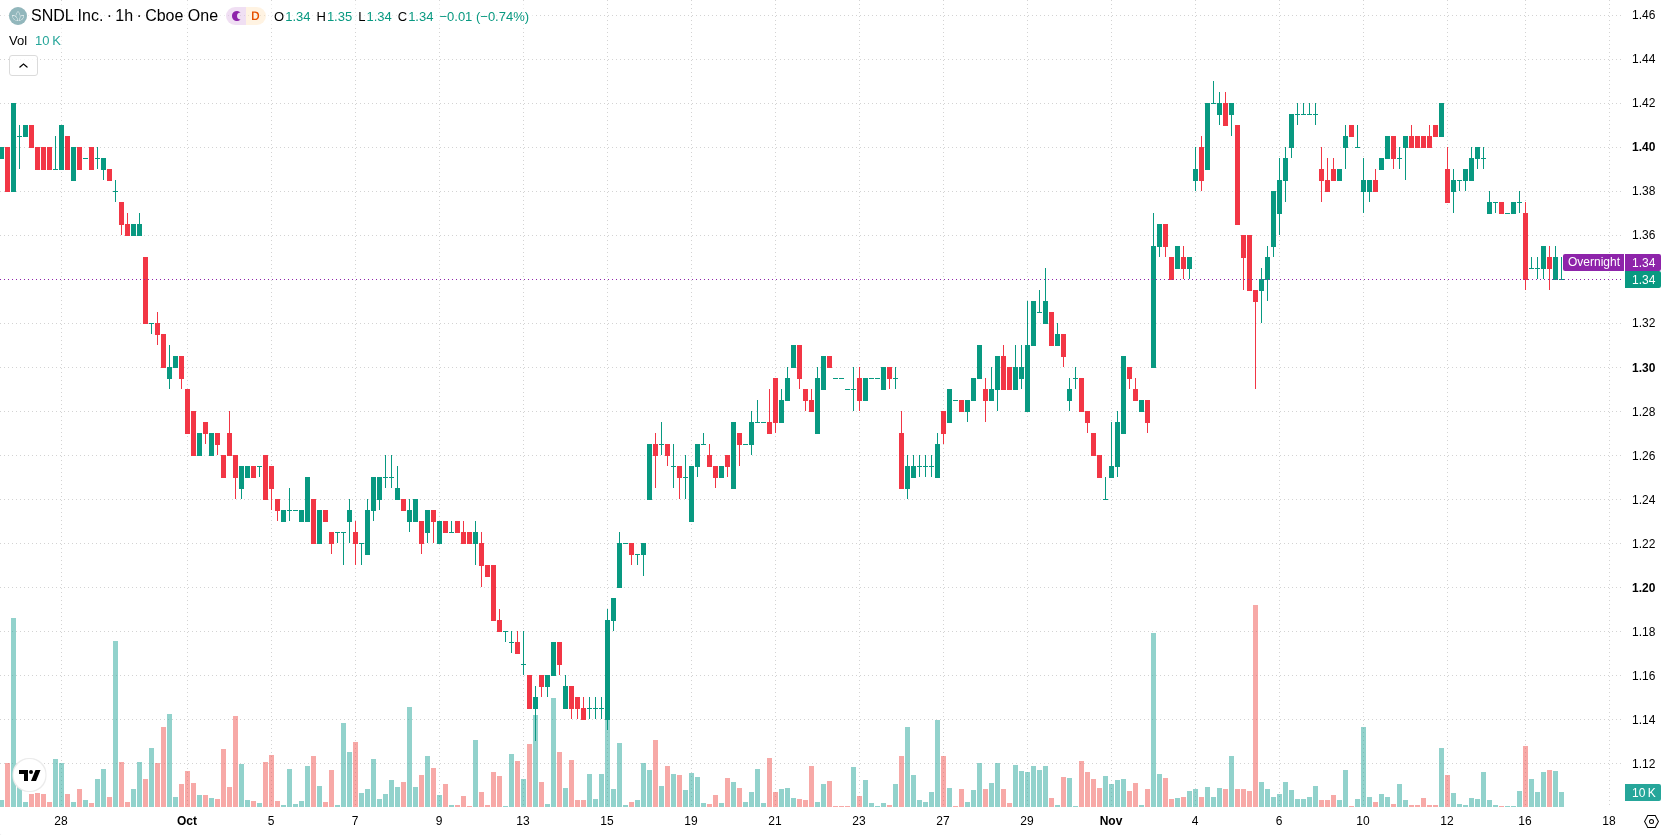
SNDL Inc. (SNDL) stock is trading at $1.34 after falling 2.21% today. The price remains below its key short-, medium-, and long-term moving averages, indicating broad technical weakness.
 1.38
1.42
Highlights
- SNDL stock trades below key moving averages, indicating persistent bearish momentum across multiple timeframes.
- Technical indicators, including MACD and ADX, give sell signals, and the stock closed down 2.21% at $1.34 with elevated volatility.
- Forecast calls for SNDL to trade between $1.3 to $1.38 in the coming sessions, with high probability of further downside.
Multiple momentum indicators signal negative bias under resistance
On the technical front, SNDL is trading below H1 SMA-20 at $1.37, H1 SMA-50 at $1.39, and D1 SMA-200 at $1.38. The Ichimoku Kijun sits at $1.38, acting as immediate resistance. Momentum remains negative, with both MACD and ADX issuing sell signals. RSI and Stoch RSI readings are neutral, while CCI has dropped into the oversold zone, hinting at possible selling exhaustion but lacking a confirmed reversal signal. Bull/Bear Power at -0.01 highlights minor intraday seller dominance, and the Awesome Oscillator is neutral with no clear trend confirmation.
High downside risk as narrow trading range persists
Looking ahead, SNDL is expected to trade within a $1.3 to $1.38 range over the next several sessions. The probability of an upward move remains very low, while the likelihood of further downside is high. The baseline scenario favors continued activity within the established range unless support at $1.3 is lost or a decisive breakout above $1.38 occurs.
Previously it was reported that despite operational improvements and share repurchases SNDL stock continued to face persistent technical weakness and downside risks. The latest price action and indicator signals reinforce this cautious outlook, with traders now watching the $1.3 support level as a critical threshold that could trigger further losses if breached.









-
 Afghanistan
-
 Albania
-
 Algeria
-
 Angola
-
 Argentina
-
 Armenia
-
 Australia
-
 Austria
-
 Azerbaijan
-
 Bahamas
-
 Bahrain
-
 Bangladesh
-
 Belarus
-
 Belgium
-
 Bolivia
-
 Botswana
-
 Brazil
-
 Brunei
-
 Bulgaria
-
 Cambodia
-
 Cameroon
-
 Canada
-
 Chile
-
 China
-
 Colombia
-
 Congo
-
 Costa Rica
-
 Cote d'Ivoire
-
 Croatia
-
 Cuba
-
 Cyprus
-
 Czechia
-
 DR Congo
-
 Denmark
-
 Dominican Republic
-
 Ecuador
-
 Egypt
-
 El Salvador
-
 Estonia
-
 Eswatini
-
 Ethiopia
-
 Finland
-
 France
-
 Georgia
-
 Germany
-
 Ghana
-
 Greece
-
 Haiti
-
 Hong Kong
-
 Hungary
-
 India
-
 Indonesia
-
 Iran, Islamic republic
-
 Iraq
-
 Ireland
-
 Israel
-
 Italy
-
 Jamaica
-
 Japan
-
 Jordan
-
 Kazakhstan
-
 Kenya
-
 Korea
-
 Kuwait
-
 Kyrgyzstan
-
 Laos
-
 Latvia
-
 Lebanon
-
 Lesotho
-
 Libya
-
 Lithuania
-
 Luxembourg
-
 Madagascar
-
 Malaysia
-
 Malta
-
 Mauritius
-
 Mexico
-
 Moldova
-
 Mongolia
-
 Montenegro
-
 Morocco
-
 Mozambique
-
 Myanmar
-
 Namibia
-
 Nepal
-
 Netherlands
-
 New Zealand
-
 Nigeria
-
 North Macedonia
-
 Norway
-
 Oman
-
 Pakistan
-
 Palestine
-
 Panama
-
 Papua New Guinea
-
 Paraguay
-
 Peru
-
 Philippines
-
 Poland
-
 Portugal
-
 Puerto Rico
-
 Qatar
-
 Reunion
-
 Romania
-
 Rwanda
-
 Saudi Arabia
-
 Serbia
-
 Singapore
-
 Slovakia
-
 Slovenia
-
 Somalia
-
 South Africa
-
 Spain
-
 Sri Lanka
-
 Sweden
-
 Switzerland
-
 Syria
-
 Taiwan
-
 Tajikistan
-
 Tanzania
-
 Thailand
-
 Trinidad and Tobago
-
 Tunisia
-
 Turkey
-
 UAE
-
 Uganda
-
 Ukraine
-
 United Kingdom
-
United States
-
 Uruguay
-
 Uzbekistan
-
 Venezuela
-
 Vietnam
-
 Yemen
-
 Zambia
-
 Zimbabwe
- Forex
- Crypto












