

BT Group stock forecast: Price likely to consolidate as recent gains are digested

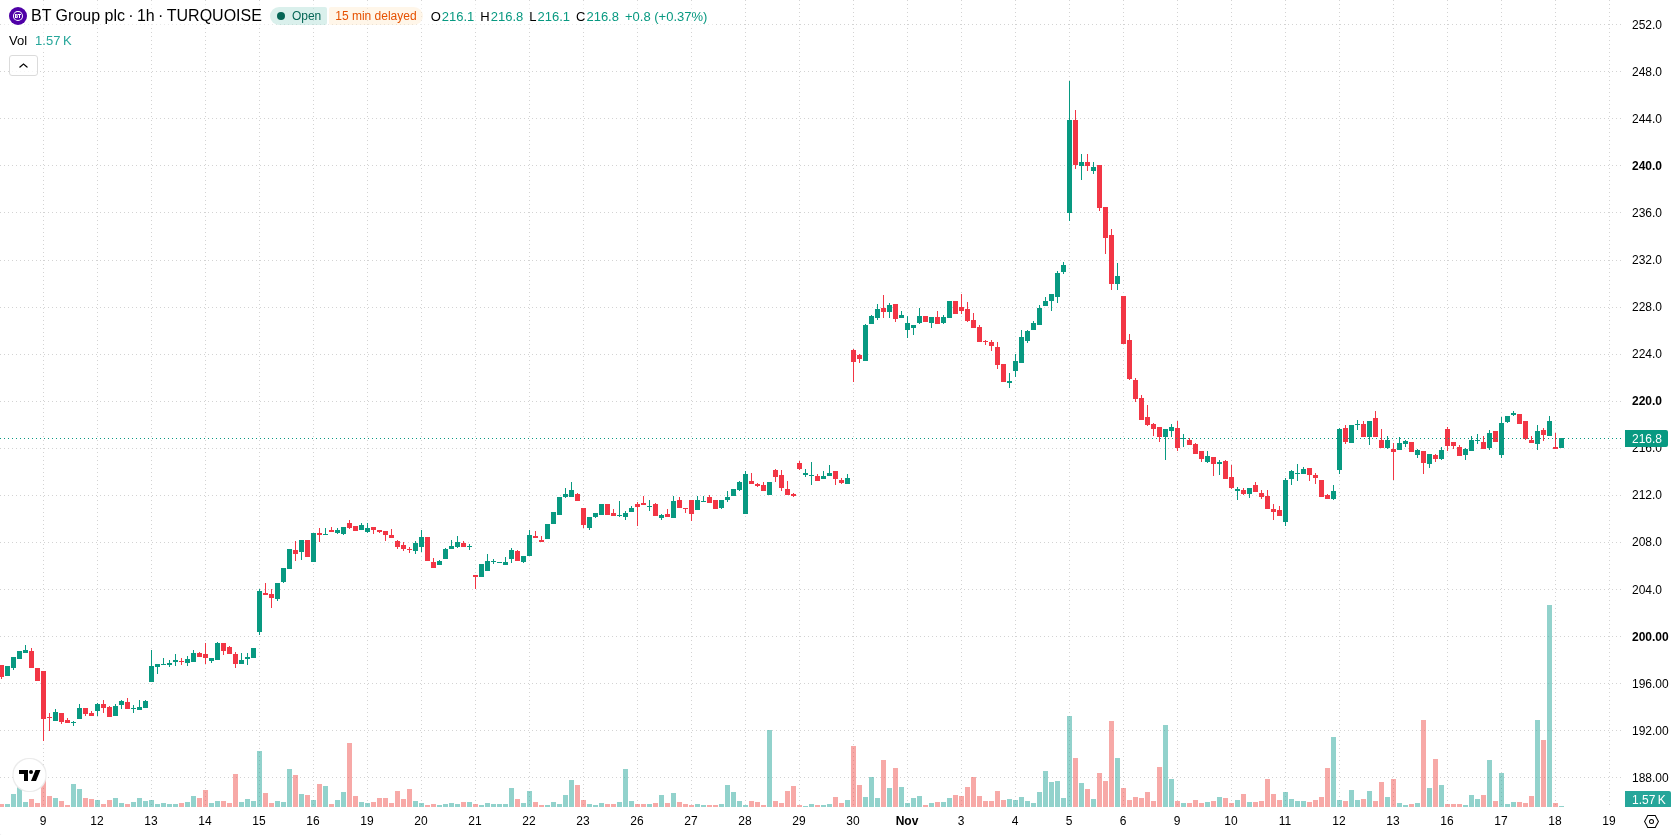
BT Group (BT-A) stock is trading at GBX218.3 after a modest gain in the latest session, with the price holding above its key short-, medium-, and long-term moving averages. The daily movement was slight, and the stock sits near the high end of today's range during a period of low volatility.
 217.40
219.30
Highlights
- BT Group reported first-half fiscal year 2027 adjusted EBITDA of £4.10 billion and adjusted revenue of £8.75 billion, both slightly higher year on year.
- The company distributed £1,500 million in dividends and cut capital spending by 5%, increasing shareholder returns and financial discipline.
- Shares of BT Group closed at GBX218.3 with a bullish technical bias, expected to trade between GBX213.74 and GBX222.86 in coming sessions.
Stable operating results and cost focus bolster sentiment following earnings
BT Group has released first-half fiscal year 2027 results, reporting adjusted EBITDA of £4.10 billion and adjusted revenue of £8.75 billion, both registering modest year-on-year increases, according to Investegate Co. This performance suggests stable core operations, which can help maintain investor interest even amid modest daily moves. The company paid out £1,500 million in dividends, directly enhancing shareholder returns, while a 5% reduction in capital expenditure points to improved financial discipline and potential future cash flow gains.
Support zones strengthen as positive momentum meets signs of overheating
On the technical front, the H1 SMA-20 at GBX216.88 and the H1 SMA-50 at GBX215.57 are both below the current price, with the D1 SMA-200 further below at GBX206.66, outlining clear support levels. The Ichimoku Kijun serves as nearby technical support at GBX216.45. MACD maintains a buy signal while ADX is neutral, indicating building but non-directional momentum. Both RSI and Stochastic RSI hover in neutral territory, and CCI is overbought, hinting at short-term overheating. Bull/Bear Power remains positive at 1.5, reflecting buyer dominance, while the Awesome Oscillator is neutral.
Price consolidation expected as breakout risk remains limited near recent gains
In the short term, BT-A is likely to remain within a volatility band between GBX213.74 and GBX222.86. The baseline scenario is for price consolidation within this band as recent gains are digested. A break above GBX222.86 could quickly trigger further upside, while falling below GBX213.74 would signal a potential retracement, though the probability of downside remains low over the next several sessions.
Earlier, analysts noted that BT Group's technical recovery had potential support from operational stability and ongoing infrastructure investment despite macroeconomic headwinds. The latest results reinforce this view, and with current technical indicators showing underlying buyer strength but short-term overheating, traders should monitor GBX222.86 as the next key resistance level for a potential breakout.






Latest BT Group News




-
 Afghanistan
-
 Albania
-
 Algeria
-
 Angola
-
 Argentina
-
 Armenia
-
 Australia
-
 Austria
-
 Azerbaijan
-
 Bahamas
-
 Bahrain
-
 Bangladesh
-
 Belarus
-
 Belgium
-
 Bolivia
-
 Botswana
-
 Brazil
-
 Brunei
-
 Bulgaria
-
 Cambodia
-
 Cameroon
-
 Canada
-
 Chile
-
 China
-
 Colombia
-
 Congo
-
 Costa Rica
-
 Cote d'Ivoire
-
 Croatia
-
 Cuba
-
 Cyprus
-
 Czechia
-
 DR Congo
-
 Denmark
-
 Dominican Republic
-
 Ecuador
-
 Egypt
-
 El Salvador
-
 Estonia
-
 Eswatini
-
 Ethiopia
-
 Finland
-
 France
-
 Georgia
-
 Germany
-
 Ghana
-
 Greece
-
 Haiti
-
 Hong Kong
-
 Hungary
-
 India
-
 Indonesia
-
 Iran, Islamic republic
-
 Iraq
-
 Ireland
-
 Israel
-
 Italy
-
 Jamaica
-
 Japan
-
 Jordan
-
 Kazakhstan
-
 Kenya
-
 Korea
-
 Kuwait
-
 Kyrgyzstan
-
 Laos
-
 Latvia
-
 Lebanon
-
 Lesotho
-
 Libya
-
 Lithuania
-
 Luxembourg
-
 Madagascar
-
 Malaysia
-
 Malta
-
 Mauritius
-
 Mexico
-
 Moldova
-
 Mongolia
-
 Montenegro
-
 Morocco
-
 Mozambique
-
 Myanmar
-
 Namibia
-
 Nepal
-
 Netherlands
-
 New Zealand
-
 Nigeria
-
 North Macedonia
-
 Norway
-
 Oman
-
 Pakistan
-
 Palestine
-
 Panama
-
 Papua New Guinea
-
 Paraguay
-
 Peru
-
 Philippines
-
 Poland
-
 Portugal
-
 Puerto Rico
-
 Qatar
-
 Reunion
-
 Romania
-
 Rwanda
-
 Saudi Arabia
-
 Serbia
-
 Singapore
-
 Slovakia
-
 Slovenia
-
 Somalia
-
 South Africa
-
 Spain
-
 Sri Lanka
-
 Sweden
-
 Switzerland
-
 Syria
-
 Taiwan
-
 Tajikistan
-
 Tanzania
-
 Thailand
-
 Trinidad and Tobago
-
 Tunisia
-
 Turkey
-
 UAE
-
 Uganda
-
 Ukraine
-
 United Kingdom
-
United States
-
 Uruguay
-
 Uzbekistan
-
 Venezuela
-
 Vietnam
-
 Yemen
-
 Zambia
-
 Zimbabwe
- Forex
- Crypto












