

Will Reckitt Benckiser stock break GBX5,829 resistance as momentum signals remain mixed?

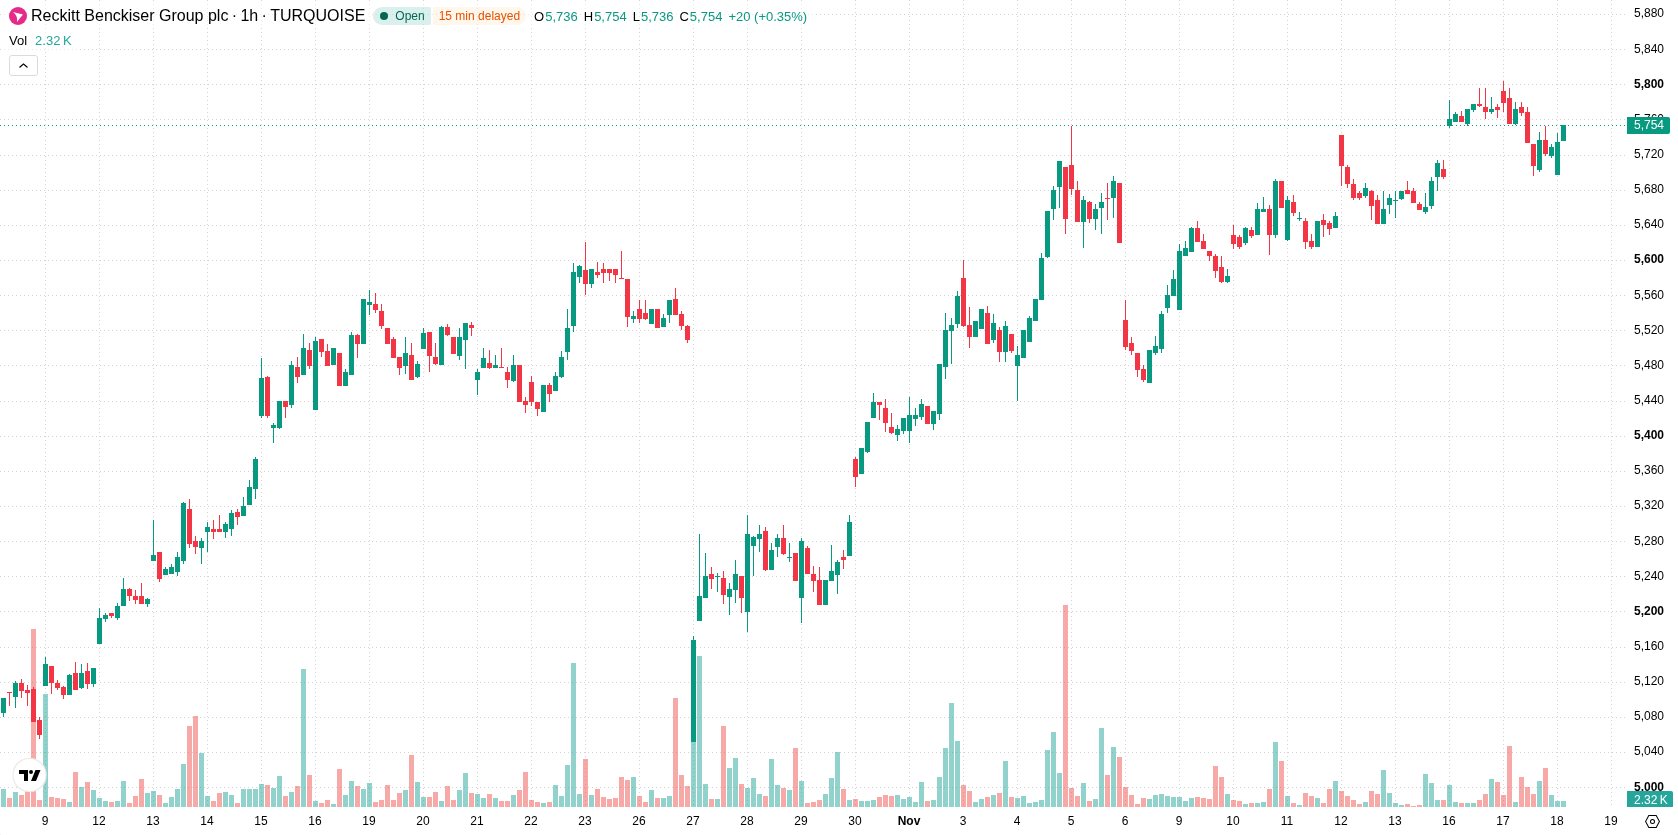
Reckitt Benckiser (RKT) stock is trading at GBX5,756 in a low-volatility session, posting a modest daily advance. The price remains positioned above its key short- and medium-term moving averages, reflecting current buyer dominance.
 5696.00
5804.00
Highlights
- RKT/GBX is in a sustained bullish trend, trading well above key short- and long-term moving averages.
- Mixed momentum signals are present, with strong buy readings from MACD and buying exhaustion indicated by oversold oscillators.
- Expected price range for the next four days is GBX5,658 to GBX5,829, with a 75% probability for an upward move.
Support holds firm as mixed momentum signals cloud trend
On the H1 timeframe, RKT is trading above the SMA-20 at GBX5,752 and the SMA-50 at GBX5,698, solidifying upward momentum above these immediate support levels. The D1 SMA-200 stands at GBX5,195, well below current pricing, and the Ichimoku Kijun is holding at GBX5,730 as the closest technical support. Momentum indicators present a mixed outlook: while MACD is showing strong buy momentum and Bull/Bear Power is positive at 6.78, ADX is signaling selling, and the Awesome Oscillator remains neutral. RSI is neutral, but both Stochastic RSI and CCI are in oversold territory, suggesting selling exhaustion may be present, though clear reversal signals are not yet established.
Upside favored as tight range and support reduce risk
Looking ahead to the next four trading days, RKT is expected to remain within a volatility band from GBX5,658 to GBX5,829. There is a 75% probability of an upward move, making downside scenarios less likely under current conditions. The baseline scenario anticipates stability in this corridor; a breakout above GBX5,829 could trigger further gains, while a decline below GBX5,658 would signal a breach of support and shift to a bearish outlook.
Earlier, analysts noted that Reckitt Benckiser was exhibiting strong technical momentum while facing potential for near-term consolidation. The current update adds nuance by highlighting mixed momentum signals and possible selling exhaustion, making GBX5,829 a key breakout level to monitor in the coming days.











-
 Afghanistan
-
 Albania
-
 Algeria
-
 Angola
-
 Argentina
-
 Armenia
-
 Australia
-
 Austria
-
 Azerbaijan
-
 Bahamas
-
 Bahrain
-
 Bangladesh
-
 Belarus
-
 Belgium
-
 Bolivia
-
 Botswana
-
 Brazil
-
 Brunei
-
 Bulgaria
-
 Cambodia
-
 Cameroon
-
 Canada
-
 Chile
-
 China
-
 Colombia
-
 Congo
-
 Costa Rica
-
 Cote d'Ivoire
-
 Croatia
-
 Cuba
-
 Cyprus
-
 Czechia
-
 DR Congo
-
 Denmark
-
 Dominican Republic
-
 Ecuador
-
 Egypt
-
 El Salvador
-
 Estonia
-
 Eswatini
-
 Ethiopia
-
 Finland
-
 France
-
 Georgia
-
 Germany
-
 Ghana
-
 Greece
-
 Haiti
-
 Hong Kong
-
 Hungary
-
 India
-
 Indonesia
-
 Iran, Islamic republic
-
 Iraq
-
 Ireland
-
 Israel
-
 Italy
-
 Jamaica
-
 Japan
-
 Jordan
-
 Kazakhstan
-
 Kenya
-
 Korea
-
 Kuwait
-
 Kyrgyzstan
-
 Laos
-
 Latvia
-
 Lebanon
-
 Lesotho
-
 Libya
-
 Lithuania
-
 Luxembourg
-
 Madagascar
-
 Malaysia
-
 Malta
-
 Mauritius
-
 Mexico
-
 Moldova
-
 Mongolia
-
 Montenegro
-
 Morocco
-
 Mozambique
-
 Myanmar
-
 Namibia
-
 Nepal
-
 Netherlands
-
 New Zealand
-
 Nigeria
-
 North Macedonia
-
 Norway
-
 Oman
-
 Pakistan
-
 Palestine
-
 Panama
-
 Papua New Guinea
-
 Paraguay
-
 Peru
-
 Philippines
-
 Poland
-
 Portugal
-
 Puerto Rico
-
 Qatar
-
 Reunion
-
 Romania
-
 Rwanda
-
 Saudi Arabia
-
 Serbia
-
 Singapore
-
 Slovakia
-
 Slovenia
-
 Somalia
-
 South Africa
-
 Spain
-
 Sri Lanka
-
 Sweden
-
 Switzerland
-
 Syria
-
 Taiwan
-
 Tajikistan
-
 Tanzania
-
 Thailand
-
 Trinidad and Tobago
-
 Tunisia
-
 Turkey
-
 UAE
-
 Uganda
-
 Ukraine
-
 United Kingdom
-
United States
-
 Uruguay
-
 Uzbekistan
-
 Venezuela
-
 Vietnam
-
 Yemen
-
 Zambia
-
 Zimbabwe
- Forex
- Crypto












