

BP shares technical analysis: Seller pressure keeps price above GBX540.33 support

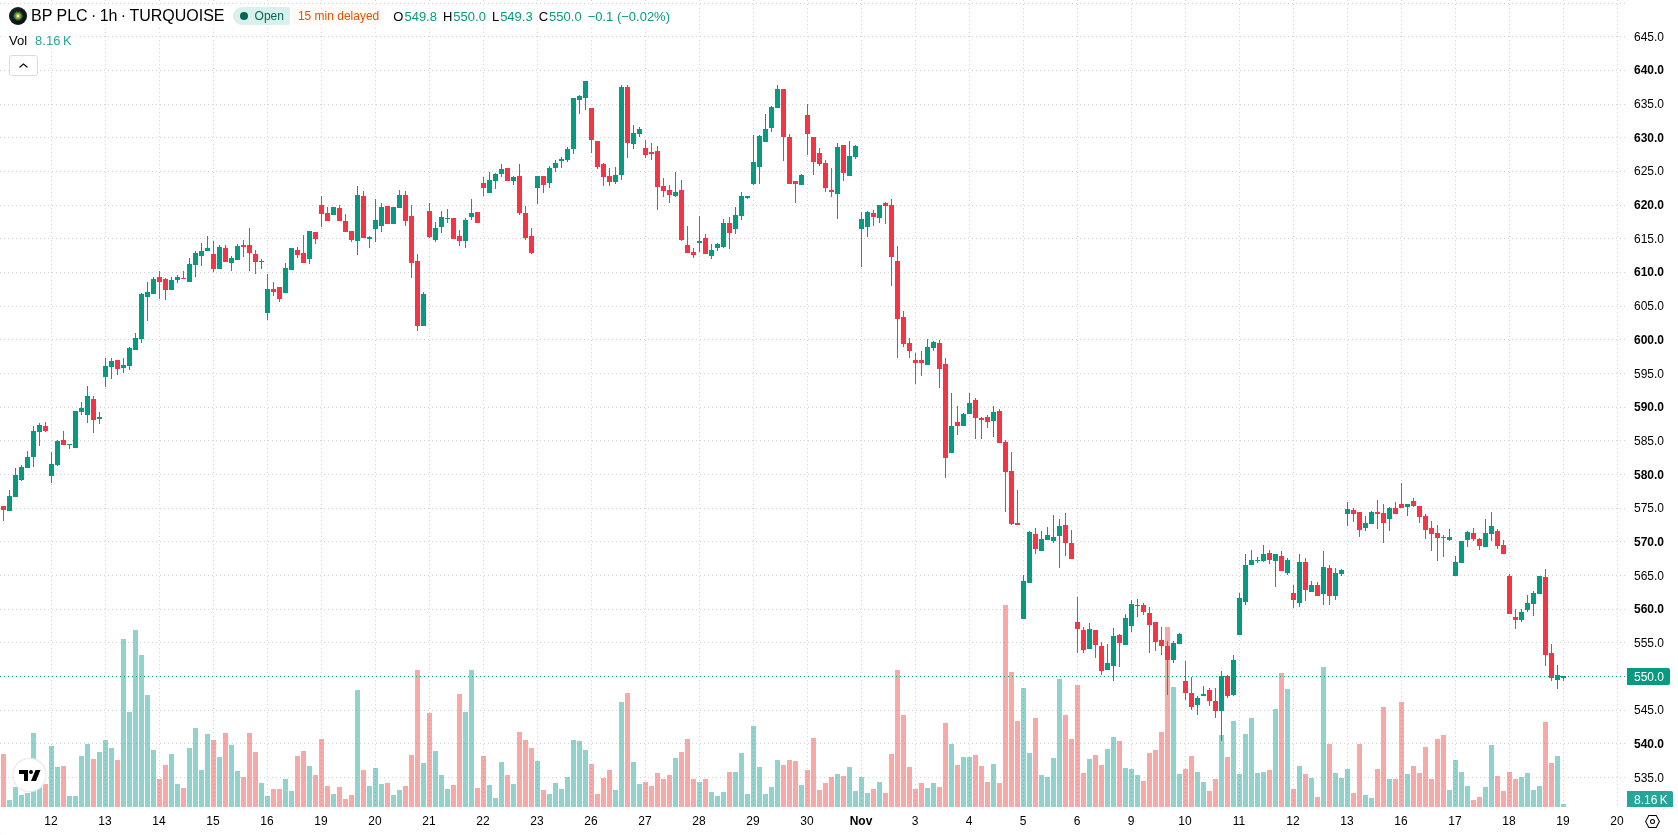
BP (BP) stock is trading at GBX550.9, down 3.01% on the day. The price sits below its key short- and medium-term moving averages, though it remains above a major long-term average, reflecting pressure from sellers with underlying long-term support still intact.
 558.60
578.80
Highlights
- Shares of BP fell after lower crude benchmarks and weak global demand reduced expected revenues and profitability.
- BP management is keeping share buybacks paused and prioritizing debt reduction and balance sheet improvement over near-term shareholder returns.
- BP/GBX trades below key short- and medium-term moving averages, with momentum indicators showing high probability of continued downside within the GBX540.3 to GBX559.4 range.
Selling pressure intensifies as oil demand weakens and buybacks pause
BP shares declined on November 18, driven by lower crude oil benchmarks and sluggish global demand, which directly weighed on the company's expected revenues and profitability as an oil producer. In addition, share buybacks remain paused while management prioritizes debt reduction and balance sheet improvement, according to TradingKey. This reduction in shareholder returns and the cautious approach to capital allocation have limited buying interest and reinforced the prevailing selling pressure.
Bearish signals dominate as short-term resistance and low momentum cap price
The H1 SMA-20 at GBX564.54 and H1 SMA-50 at GBX567.65 are both positioned above the current price, while the D1 SMA-200 at GBX540.33 sits below it, outlining well-defined technical boundaries. The Ichimoku Kijun at GBX562.4 serves as immediate resistance. Momentum readings are weak: MACD and ADX indicate a prevailing sell bias, and Bull/Bear Power is negative at -8.15, supporting intraday dominance by sellers. While the RSI remains neutral, both Stochastic RSI and CCI are in their respective oversold zones, hinting at potential selling exhaustion but with no confirmation of reversal. The Awesome Oscillator continues to signal a bearish outlook, and volatility for the session is low as the price trades near the daily low.
Sideways trading projected as upside prospects remain limited
Over the next few days, BP is likely to fluctuate within the GBX540.3 to GBX559.4 range, reflecting a typical volatility band relative to current levels. The probability of upward movement is low at 22%, while the chance of further downside is higher at 78%. The baseline scenario indicates sideways consolidation within this band. A break above the Ichimoku Kijun could prompt a short-term bounce, while a decline below GBX540.3 would likely accelerate the bearish move.
Earlier, analysts noted that BP stock was expected to remain in a phase of sideways consolidation amid broader market uncertainty and paused buybacks. The latest technical and fundamental developments reinforce this cautious outlook, with traders now advised to monitor GBX540.3 as a critical support level that could trigger further downside if breached.










-
 Afghanistan
-
 Albania
-
 Algeria
-
 Angola
-
 Argentina
-
 Armenia
-
 Australia
-
 Austria
-
 Azerbaijan
-
 Bahamas
-
 Bahrain
-
 Bangladesh
-
 Belarus
-
 Belgium
-
 Bolivia
-
 Botswana
-
 Brazil
-
 Brunei
-
 Bulgaria
-
 Cambodia
-
 Cameroon
-
 Canada
-
 Chile
-
 China
-
 Colombia
-
 Congo
-
 Costa Rica
-
 Cote d'Ivoire
-
 Croatia
-
 Cuba
-
 Cyprus
-
 Czechia
-
 DR Congo
-
 Denmark
-
 Dominican Republic
-
 Ecuador
-
 Egypt
-
 El Salvador
-
 Estonia
-
 Eswatini
-
 Ethiopia
-
 Finland
-
 France
-
 Georgia
-
 Germany
-
 Ghana
-
 Greece
-
 Haiti
-
 Hong Kong
-
 Hungary
-
 India
-
 Indonesia
-
 Iran, Islamic republic
-
 Iraq
-
 Ireland
-
 Israel
-
 Italy
-
 Jamaica
-
 Japan
-
 Jordan
-
 Kazakhstan
-
 Kenya
-
 Korea
-
 Kuwait
-
 Kyrgyzstan
-
 Laos
-
 Latvia
-
 Lebanon
-
 Lesotho
-
 Libya
-
 Lithuania
-
 Luxembourg
-
 Madagascar
-
 Malaysia
-
 Malta
-
 Mauritius
-
 Mexico
-
 Moldova
-
 Mongolia
-
 Montenegro
-
 Morocco
-
 Mozambique
-
 Myanmar
-
 Namibia
-
 Nepal
-
 Netherlands
-
 New Zealand
-
 Nigeria
-
 North Macedonia
-
 Norway
-
 Oman
-
 Pakistan
-
 Palestine
-
 Panama
-
 Papua New Guinea
-
 Paraguay
-
 Peru
-
 Philippines
-
 Poland
-
 Portugal
-
 Puerto Rico
-
 Qatar
-
 Reunion
-
 Romania
-
 Rwanda
-
 Saudi Arabia
-
 Serbia
-
 Singapore
-
 Slovakia
-
 Slovenia
-
 Somalia
-
 South Africa
-
 Spain
-
 Sri Lanka
-
 Sweden
-
 Switzerland
-
 Syria
-
 Taiwan
-
 Tajikistan
-
 Tanzania
-
 Thailand
-
 Trinidad and Tobago
-
 Tunisia
-
 Turkey
-
 UAE
-
 Uganda
-
 Ukraine
-
 United Kingdom
-
United States
-
 Uruguay
-
 Uzbekistan
-
 Venezuela
-
 Vietnam
-
 Yemen
-
 Zambia
-
 Zimbabwe
- Forex
- Crypto












