

Arm Holdings posts strong Q2 results, insider sale: ARM remains range-bound near $182.52 support

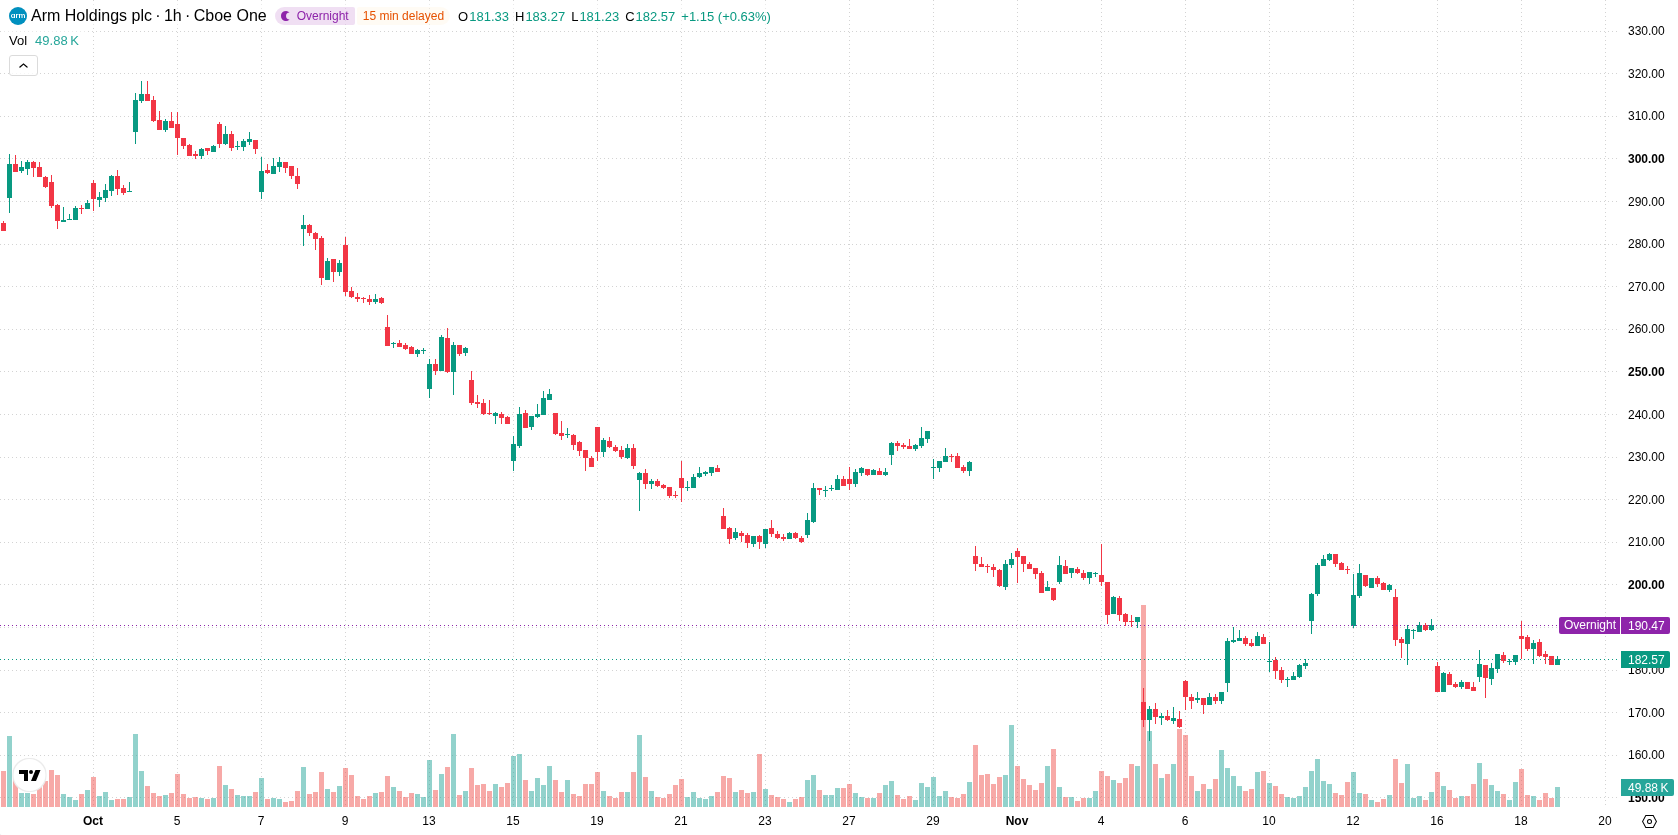
Arm (ARM) stock is trading at $182.76, reflecting a marginal move lower for the day amid heightened intraday volatility. The price remains above its near-term moving averages but is still lagging behind medium- and long-term trend measures.
 190.79
204.52
Highlights
- Arm Holdings reported second quarter fiscal 2027 revenue of $1.44 billion, up 27% year over year, and non-GAAP EPS of $0.52, up 33%.
- Chief architect Richard Grisenthwaite sold 5,762 shares for over $1 million, indicating recent insider activity.
- Shares of Arm Holdings trade sideways in a range of $168.87 to $196.65, with technical indicators showing short-term seller pressure and a 29% probability of an upward move.
Earnings beat and insider sale reinforce robust core performance
Arm Holdings reported a 27% year-over-year increase in second quarter fiscal 2027 revenue to $1.44 billion and a 33% rise in non-GAAP earnings per share to $0.52, according to Investing.com. This strong set of results highlights robust performance across its core business units, supporting the company’s operating momentum. In addition, chief architect Richard Grisenthwaite executed a sale of 5,762 shares valued at over $1 million on November 17, as reported by Marketbeat, providing a data point on recent insider activity.
Conflicting technical signals amid volatile trade and mild buyer bias
On the hourly chart, ARM is trading above the H1 SMA-20 at $181.02, while remaining below the H1 SMA-50 at $187.82 and the D1 SMA-200 at $233.94. Immediate support is provided by the Ichimoku Kijun at $182.52. Momentum indicators are mixed: MACD is signaling a strong sell, ADX is neutral, and RSI, Stoch RSI, and CCI all remain neutral, showing neither overbought nor oversold conditions. Bull/Bear Power is slightly positive at 0.19, pointing to mild intraday buyer activity, while the Awesome Oscillator continues to indicate a sell. The technical picture reflects a market with conflicting signals and little extreme momentum, as high intraday volatility persists near session lows.
Sideways price action expected as downside risk dominates outlook
Over the next several sessions, ARM is expected to trade within a volatility band of $168.87 to $196.65. The probability of an upward breakout is estimated at 29%, with downside risk taking precedence. The baseline scenario anticipates sideways movement inside the stated range. Should price break above resistance, a move toward the upper end of the range may follow, whereas a drop below support could accelerate losses toward the lower boundary.
Earlier, analysts noted that Arm was viewed as a technology name worth owning, highlighted by its strong execution and exposure to semiconductor demand. The current technical environment adds a layer of caution, with intraday volatility and mixed signals reinforcing a prevailing scenario of range-bound trading where a break below key support could accelerate downside risk.











-
 Afghanistan
-
 Albania
-
 Algeria
-
 Angola
-
 Argentina
-
 Armenia
-
 Australia
-
 Austria
-
 Azerbaijan
-
 Bahamas
-
 Bahrain
-
 Bangladesh
-
 Belarus
-
 Belgium
-
 Bolivia
-
 Botswana
-
 Brazil
-
 Brunei
-
 Bulgaria
-
 Cambodia
-
 Cameroon
-
 Canada
-
 Chile
-
 China
-
 Colombia
-
 Congo
-
 Costa Rica
-
 Cote d'Ivoire
-
 Croatia
-
 Cuba
-
 Cyprus
-
 Czechia
-
 DR Congo
-
 Denmark
-
 Dominican Republic
-
 Ecuador
-
 Egypt
-
 El Salvador
-
 Estonia
-
 Eswatini
-
 Ethiopia
-
 Finland
-
 France
-
 Georgia
-
 Germany
-
 Ghana
-
 Greece
-
 Haiti
-
 Hong Kong
-
 Hungary
-
 India
-
 Indonesia
-
 Iran, Islamic republic
-
 Iraq
-
 Ireland
-
 Israel
-
 Italy
-
 Jamaica
-
 Japan
-
 Jordan
-
 Kazakhstan
-
 Kenya
-
 Korea
-
 Kuwait
-
 Kyrgyzstan
-
 Laos
-
 Latvia
-
 Lebanon
-
 Lesotho
-
 Libya
-
 Lithuania
-
 Luxembourg
-
 Madagascar
-
 Malaysia
-
 Malta
-
 Mauritius
-
 Mexico
-
 Moldova
-
 Mongolia
-
 Montenegro
-
 Morocco
-
 Mozambique
-
 Myanmar
-
 Namibia
-
 Nepal
-
 Netherlands
-
 New Zealand
-
 Nigeria
-
 North Macedonia
-
 Norway
-
 Oman
-
 Pakistan
-
 Palestine
-
 Panama
-
 Papua New Guinea
-
 Paraguay
-
 Peru
-
 Philippines
-
 Poland
-
 Portugal
-
 Puerto Rico
-
 Qatar
-
 Reunion
-
 Romania
-
 Rwanda
-
 Saudi Arabia
-
 Serbia
-
 Singapore
-
 Slovakia
-
 Slovenia
-
 Somalia
-
 South Africa
-
 Spain
-
 Sri Lanka
-
 Sweden
-
 Switzerland
-
 Syria
-
 Taiwan
-
 Tajikistan
-
 Tanzania
-
 Thailand
-
 Trinidad and Tobago
-
 Tunisia
-
 Turkey
-
 UAE
-
 Uganda
-
 Ukraine
-
 United Kingdom
-
United States
-
 Uruguay
-
 Uzbekistan
-
 Venezuela
-
 Vietnam
-
 Yemen
-
 Zambia
-
 Zimbabwe
- Forex
- Crypto












