

Nano Dimension shares technical analysis: Downward momentum persists below key resistance

Nano Dimension (NNDM) stock is trading at $1.15, down 3.89% on the day. The price remains positioned below its key moving averages, reflecting ongoing downward momentum amid heightened volatility.
 1.11
1.24
Highlights
- Quantum acquired Global Inkjet Systems from Nano Dimension on November 16, 2026, in a deal worth $16 million comprising shares and warrants.
- The sale removes an operating unit from Nano Dimension and may impact its income sources and strategic allocation.
- Shares of Nano Dimension have dropped 3.89% to $1.15, trading below key averages with sustained bearish signals and a projected $1.06 to $1.24 range over the next 2 to 3 days.
Asset sales shift income outlook as firm divests key business
QTREX Quantum completed the acquisition of Global Inkjet Systems from Nano Dimension on November 16, 2026, with the deal valued at $16 million and structured to include both shares and warrants, according to Rallies. This transaction removes an operating unit from Nano Dimension's portfolio, representing a shift in the company’s asset base and potential capital allocation. The adjustment may influence near-term expectations regarding Nano Dimension's income sources and strategic focus, as the market assesses impacts to its operational profile.
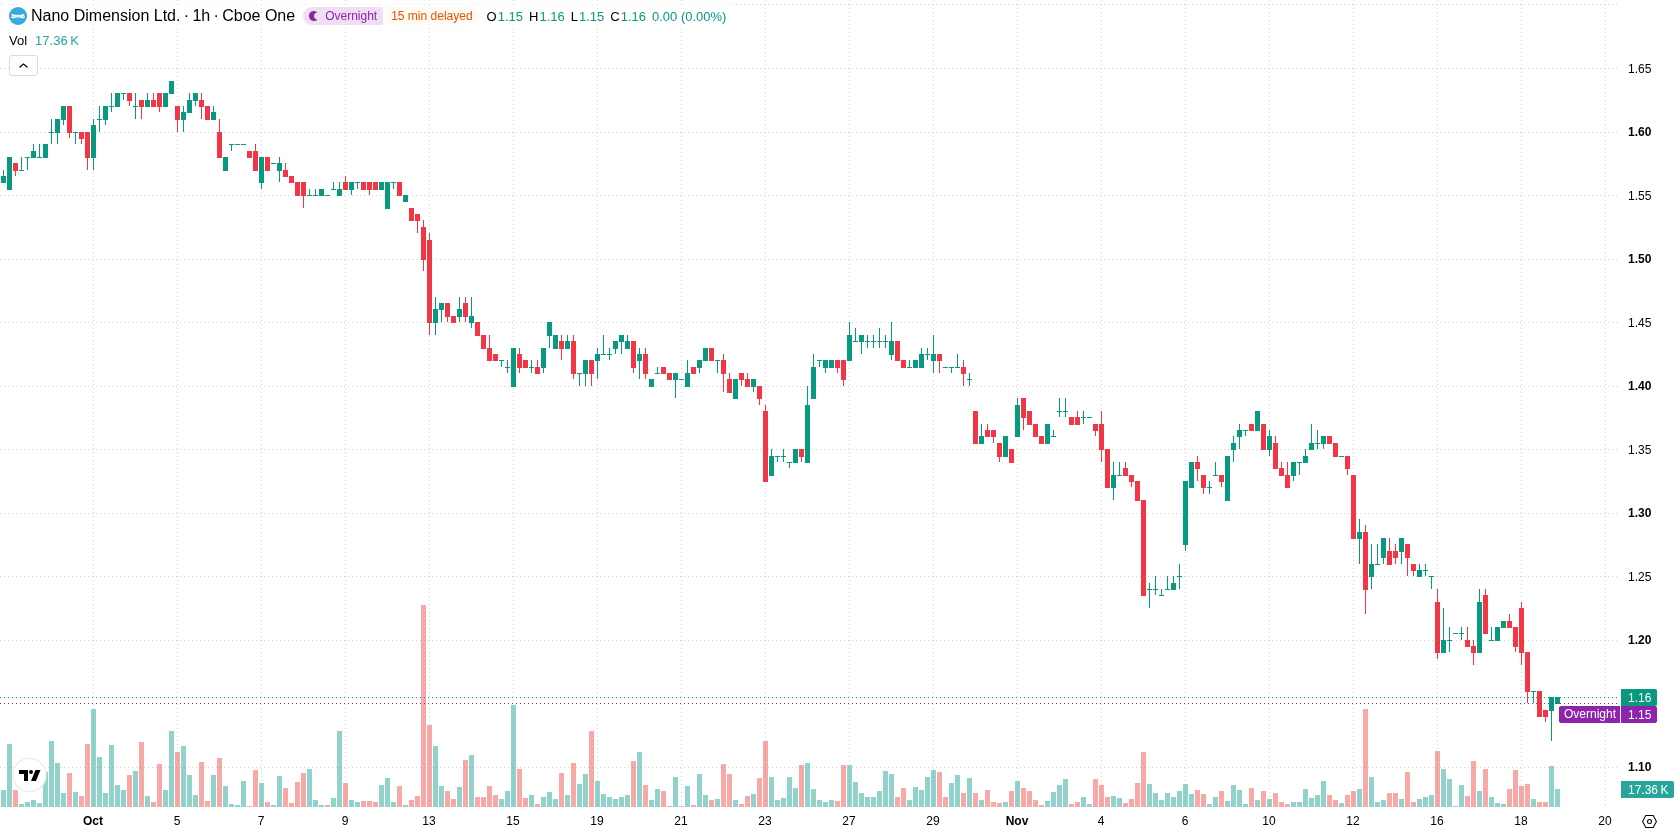
Selling pressure prevails as price remains under resistance and signals stay weak
Technically, NNDM is trading below the H1 SMA-20 at $1.19 and H1 SMA-50 at $1.26, while also holding under the D1 SMA-200 at $1.6. The Ichimoku Kijun on the H1 chart stands at $1.2, providing immediate resistance and acting as a near-term ceiling. Momentum indicators, including MACD and ADX, continue to produce sell signals, whereas RSI and Stoch RSI are neutral, showing neither overbought nor oversold conditions. The CCI is now in oversold territory, indicating possible selling exhaustion. Bull/Bear Power remains slightly negative at -0.02, reflecting the persistence of intraday selling pressure, while the Awesome Oscillator stays neutral.
Downside risk elevated as volatility persists within tightening trading band
Looking ahead over the next 2–3 trading days, NNDM is likely to remain volatile within a price corridor of $1.06 to $1.24, marking a typical volatility band relative to current levels. The likelihood of a sustained upward move remains very low, with prospects for additional downside considered high based on momentum and resistance levels. The baseline scenario is for price consolidation between immediate support and resistance. If NNDM breaks above the $1.2 resistance level, a short-term rebound could develop; conversely, a breach below $1.06 would increase the risk of a further decline.
Earlier, analysts noted that Nano Dimension's technical outlook was bearish amid persistent downside momentum across all timeframes. The current analysis reaffirms this negative bias, with heightened volatility and key resistance at $1.20 underscoring the importance of monitoring a potential breakdown below the $1.06 support level in the near term.






Latest Nano Dimension News




-
 Afghanistan
-
 Albania
-
 Algeria
-
 Angola
-
 Argentina
-
 Armenia
-
 Australia
-
 Austria
-
 Azerbaijan
-
 Bahamas
-
 Bahrain
-
 Bangladesh
-
 Belarus
-
 Belgium
-
 Bolivia
-
 Botswana
-
 Brazil
-
 Brunei
-
 Bulgaria
-
 Cambodia
-
 Cameroon
-
 Canada
-
 Chile
-
 China
-
 Colombia
-
 Congo
-
 Costa Rica
-
 Cote d'Ivoire
-
 Croatia
-
 Cuba
-
 Cyprus
-
 Czechia
-
 DR Congo
-
 Denmark
-
 Dominican Republic
-
 Ecuador
-
 Egypt
-
 El Salvador
-
 Estonia
-
 Eswatini
-
 Ethiopia
-
 Finland
-
 France
-
 Georgia
-
 Germany
-
 Ghana
-
 Greece
-
 Haiti
-
 Hong Kong
-
 Hungary
-
 India
-
 Indonesia
-
 Iran, Islamic republic
-
 Iraq
-
 Ireland
-
 Israel
-
 Italy
-
 Jamaica
-
 Japan
-
 Jordan
-
 Kazakhstan
-
 Kenya
-
 Korea
-
 Kuwait
-
 Kyrgyzstan
-
 Laos
-
 Latvia
-
 Lebanon
-
 Lesotho
-
 Libya
-
 Lithuania
-
 Luxembourg
-
 Madagascar
-
 Malaysia
-
 Malta
-
 Mauritius
-
 Mexico
-
 Moldova
-
 Mongolia
-
 Montenegro
-
 Morocco
-
 Mozambique
-
 Myanmar
-
 Namibia
-
 Nepal
-
 Netherlands
-
 New Zealand
-
 Nigeria
-
 North Macedonia
-
 Norway
-
 Oman
-
 Pakistan
-
 Palestine
-
 Panama
-
 Papua New Guinea
-
 Paraguay
-
 Peru
-
 Philippines
-
 Poland
-
 Portugal
-
 Puerto Rico
-
 Qatar
-
 Reunion
-
 Romania
-
 Rwanda
-
 Saudi Arabia
-
 Serbia
-
 Singapore
-
 Slovakia
-
 Slovenia
-
 Somalia
-
 South Africa
-
 Spain
-
 Sri Lanka
-
 Sweden
-
 Switzerland
-
 Syria
-
 Taiwan
-
 Tajikistan
-
 Tanzania
-
 Thailand
-
 Trinidad and Tobago
-
 Tunisia
-
 Turkey
-
 UAE
-
 Uganda
-
 Ukraine
-
 United Kingdom
-
United States
-
 Uruguay
-
 Uzbekistan
-
 Venezuela
-
 Vietnam
-
 Yemen
-
 Zambia
-
 Zimbabwe
- Forex
- Crypto












