


Nano Dimension Ltd (NNDM) fell 3.48% today as heavy technical selling pressure continued to weigh on the stock. The downtrend is supported by NNDM trading below its 20-day, 50-day, and 200-day moving averages, reinforcing broad weakness across all observed timeframes.
 1.11
1.24
Highlights
- Nano Dimension stock trades below its 20-day, 50-day, and 200-day moving averages, confirming sustained selling pressure.
- Momentum indicators including MACD, ADX, RSI, and the Awesome Oscillator all register persistent bearish signals with oversold conditions.
- The expected price range for the next 5 trading days is $1.03 to $1.19, with over 80% probability of a downward move.
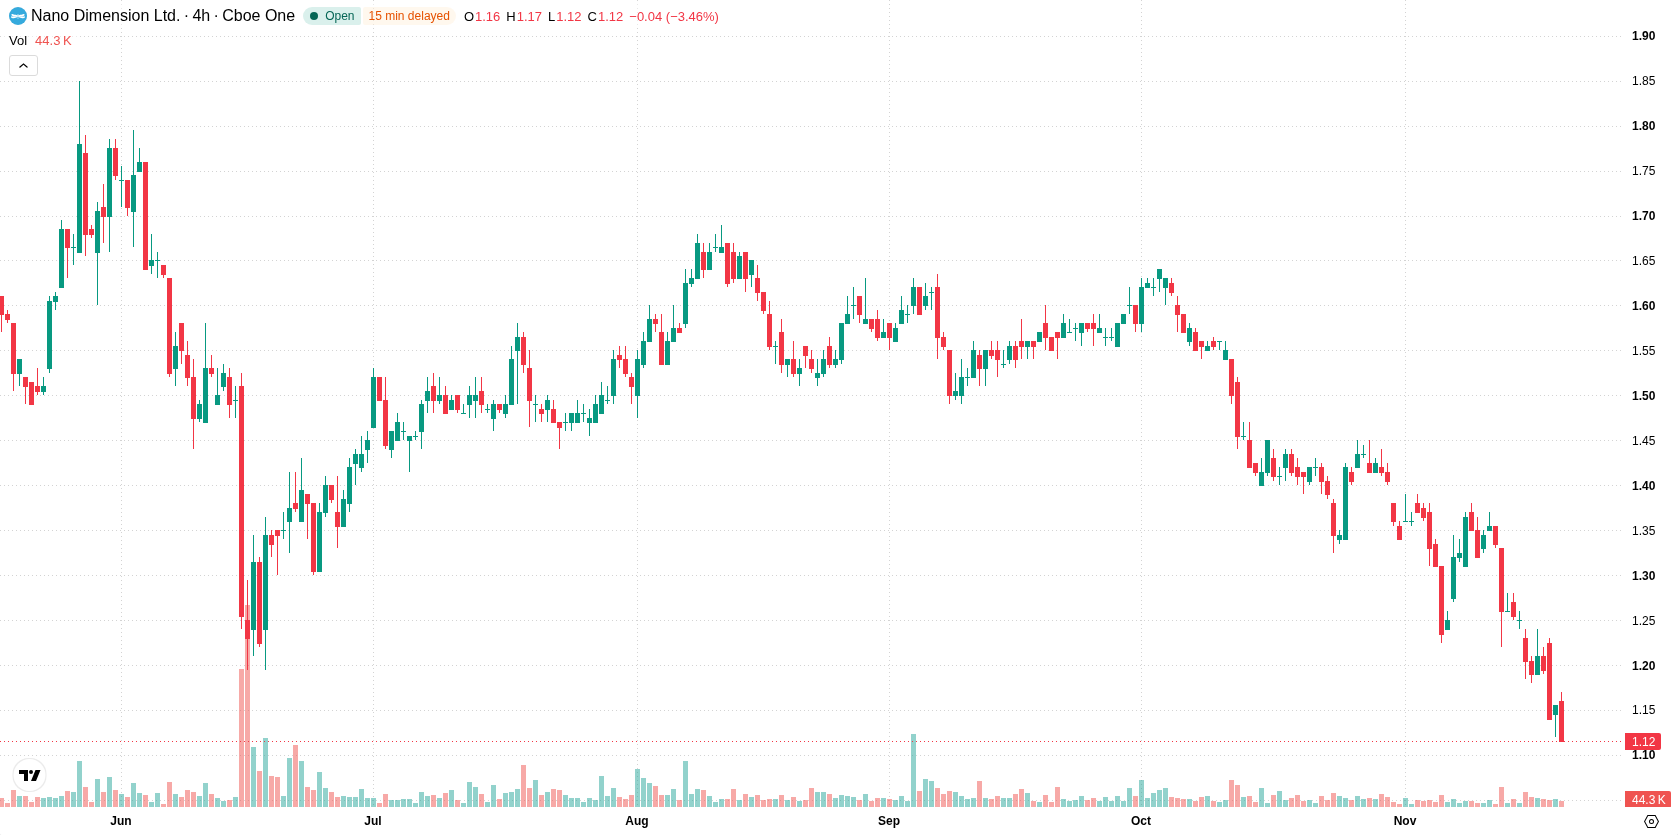
Bearish momentum intensifies as support holds and oversold signals deepen
Nano Dimension is trading below its 20-day, 50-day, and 200-day moving averages ($1.32, $1.45, and $1.6, respectively), indicating persistent selling pressure across all observed timeframes. Near-term technicals identify $1.12 as the immediate ceiling and $1.03 as the lower bound for the current forecast band, with the MA-50 remaining below the MA-200, confirming a bearish long-term trend. Momentum indicators reflect ongoing weakness: the MACD and Average Directional Index (ADX) both signal a sell, with the ADX at 43.05 confirming a strong downtrend. The Relative Strength Index (RSI) at 26.7, Stochastic RSI at 0, and CCI at -167.08 are all in oversold territory, highlighting downside exhaustion risk without guaranteeing a rebound. Negative Bull/Bear Power signals ongoing seller dominance intraday, and the Awesome Oscillator (AO) continues to reinforce the prevailing negative momentum.
Earlier, analysts noted that Nano Dimension’s technical outlook remained firmly bearish due to persistent downward momentum and underperformance relative to key moving averages. The current analysis reinforces this negative trend, with ongoing selling pressure and oversold momentum indicators pointing to $1.03 as a critical support level that traders should closely monitor.






Latest Nano Dimension News




-
 Afghanistan
-
 Albania
-
 Algeria
-
 Angola
-
 Argentina
-
 Armenia
-
 Australia
-
 Austria
-
 Azerbaijan
-
 Bahamas
-
 Bahrain
-
 Bangladesh
-
 Belarus
-
 Belgium
-
 Bolivia
-
 Botswana
-
 Brazil
-
 Brunei
-
 Bulgaria
-
 Cambodia
-
 Cameroon
-
 Canada
-
 Chile
-
 China
-
 Colombia
-
 Congo
-
 Costa Rica
-
 Cote d'Ivoire
-
 Croatia
-
 Cuba
-
 Cyprus
-
 Czechia
-
 DR Congo
-
 Denmark
-
 Dominican Republic
-
 Ecuador
-
 Egypt
-
 El Salvador
-
 Estonia
-
 Eswatini
-
 Ethiopia
-
 Finland
-
 France
-
 Georgia
-
 Germany
-
 Ghana
-
 Greece
-
 Haiti
-
 Hong Kong
-
 Hungary
-
 India
-
 Indonesia
-
 Iran, Islamic republic
-
 Iraq
-
 Ireland
-
 Israel
-
 Italy
-
 Jamaica
-
 Japan
-
 Jordan
-
 Kazakhstan
-
 Kenya
-
 Korea
-
 Kuwait
-
 Kyrgyzstan
-
 Laos
-
 Latvia
-
 Lebanon
-
 Lesotho
-
 Libya
-
 Lithuania
-
 Luxembourg
-
 Madagascar
-
 Malaysia
-
 Malta
-
 Mauritius
-
 Mexico
-
 Moldova
-
 Mongolia
-
 Montenegro
-
 Morocco
-
 Mozambique
-
 Myanmar
-
 Namibia
-
 Nepal
-
 Netherlands
-
 New Zealand
-
 Nigeria
-
 North Macedonia
-
 Norway
-
 Oman
-
 Pakistan
-
 Palestine
-
 Panama
-
 Papua New Guinea
-
 Paraguay
-
 Peru
-
 Philippines
-
 Poland
-
 Portugal
-
 Puerto Rico
-
 Qatar
-
 Reunion
-
 Romania
-
 Rwanda
-
 Saudi Arabia
-
 Serbia
-
 Singapore
-
 Slovakia
-
 Slovenia
-
 Somalia
-
 South Africa
-
 Spain
-
 Sri Lanka
-
 Sweden
-
 Switzerland
-
 Syria
-
 Taiwan
-
 Tajikistan
-
 Tanzania
-
 Thailand
-
 Trinidad and Tobago
-
 Tunisia
-
 Turkey
-
 UAE
-
 Uganda
-
 Ukraine
-
 United Kingdom
-
United States
-
 Uruguay
-
 Uzbekistan
-
 Venezuela
-
 Vietnam
-
 Yemen
-
 Zambia
-
 Zimbabwe
- Forex
- Crypto












