

Manulife Financial shares technical analysis: Seller pressure dominates above C$60.62 support

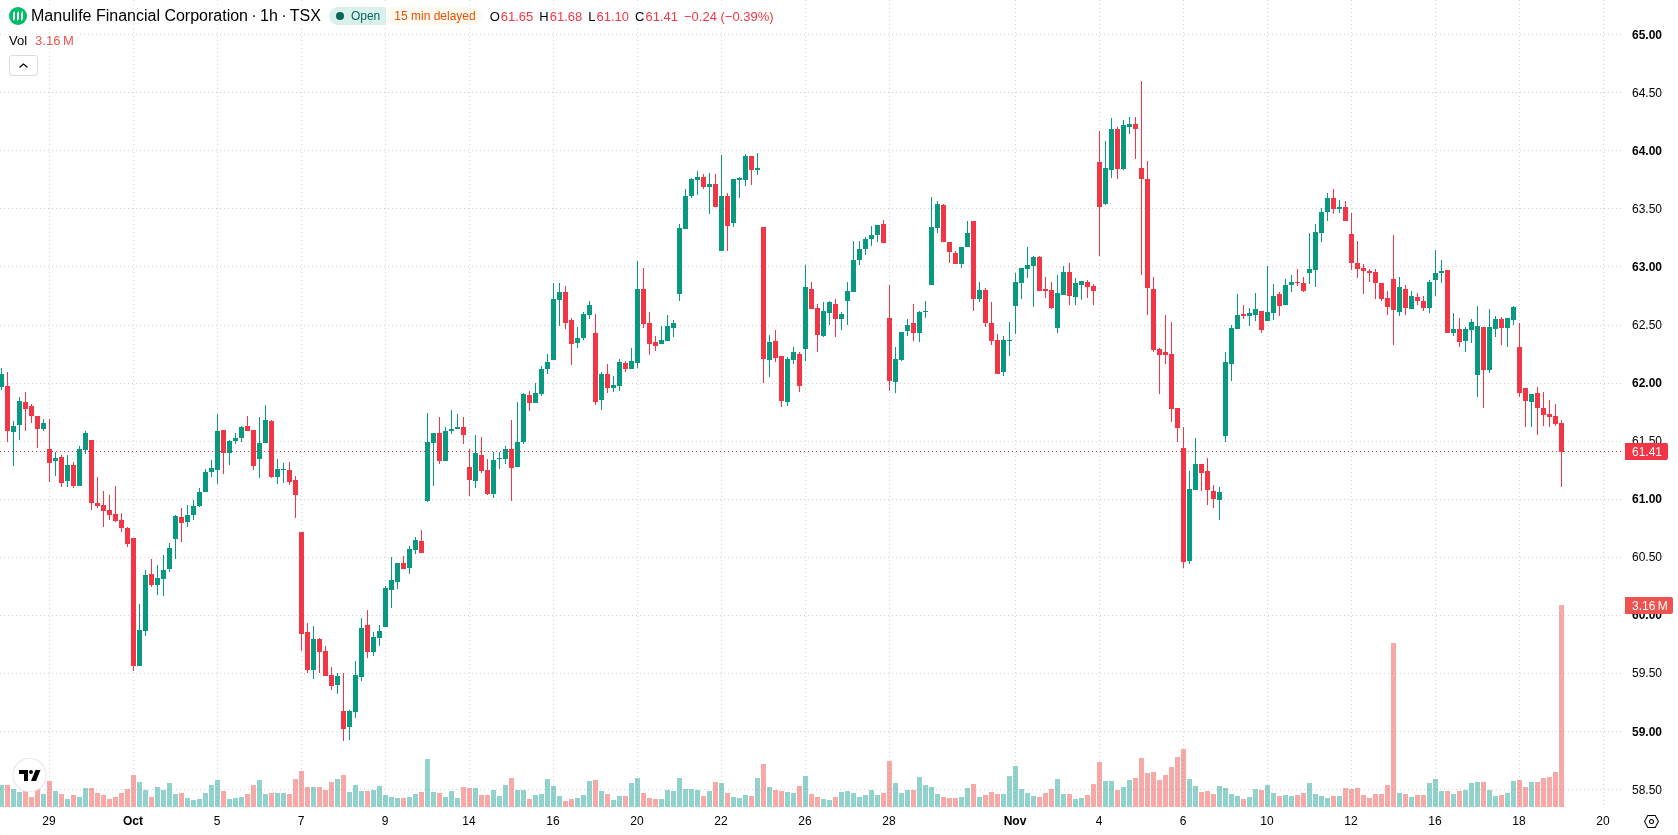
Manulife Financial (MFC) stock is trading at C$61.36 after a modest decline today, with the price slipping 0.5%. The stock sits below its key short- and medium-term moving averages but remains above its long-term trend indicator.
 62.51
63.20
Highlights
- Manulife Financial announced a quarterly dividend of $0.4850 per share payable to holders of record on December 21, 2026.
- The company is increasing its shareholder engagement through a national longevity symposium and upcoming conference participation, though these actions have not moved the stock price.
- Shares of Manulife trade below short- and medium-term moving averages with high downside risk and an expected range of C$60.62 to C$62.1 over the next few days.
Stable dividend policy and new initiatives met with market indifference
Manulife Financial has declared a quarterly dividend of $0.4850 per share for shareholders of record on December 21, 2026, reflecting the company’s continued capital return policy and providing a stable income anchor for investors, as reported by Thecerbatgem. The announcement of an inaugural national symposium series focused on longevity, according to Stockhouse, broadens the company’s engagement on key demographic trends but has not translated into immediate market momentum. Additionally, the upcoming ex-dividend for Series 19 preferred shares and CFO Colin Simpson’s participation in the Desjardins Toronto Conference offer further shareholder engagement and corporate visibility. Despite these developments, price action has remained under broader selling pressure.
Bearish momentum and oversold signals constrain upside prospects
The current price is positioned below the H1 SMA-20 at C$62.25 and H1 SMA-50 at C$62.66, while holding above the D1 SMA-200 at C$56.23. Immediate resistance is marked by the Ichimoku Kijun at C$62.35. Indicators show MACD and ADX signalling bearish momentum; RSI is neutral, with both Stochastic RSI and CCI in oversold regions, highlighting short-term rebound potential. Bull/Bear Power is negative at -0.21, and the Awesome Oscillator is neutral, together suggesting sellers control the intraday period but momentum for a sustained reversal is not yet established.
Downside risk elevated as resistance limits rebound potential
Over the next 2–3 trading days, MFC is expected to fluctuate within a corridor between C$60.62 and C$62.1. The likelihood of a further decline remains high, supported by the prevailing technical setup, while prospects for a significant upward move are limited. Should the price recover above immediate resistance at C$62.35, further gains could follow. Conversely, a break below C$60.62 would likely accelerate selling pressure and extend the downside volatility band.
Earlier, analysts noted that Manulife Financial was exhibiting mixed technical signals, with recent funding initiatives enhancing its financial flexibility but leaving the near-term trend uncertain. The present analysis adds that, despite new dividend and event announcements, prevailing technical momentum remains negative and downside risk dominates, making a break below C$60.62 a key level to watch for further selling pressure.






Latest Manulife Financial News




-
 Afghanistan
-
 Albania
-
 Algeria
-
 Angola
-
 Argentina
-
 Armenia
-
 Australia
-
 Austria
-
 Azerbaijan
-
 Bahamas
-
 Bahrain
-
 Bangladesh
-
 Belarus
-
 Belgium
-
 Bolivia
-
 Botswana
-
 Brazil
-
 Brunei
-
 Bulgaria
-
 Cambodia
-
 Cameroon
-
 Canada
-
 Chile
-
 China
-
 Colombia
-
 Congo
-
 Costa Rica
-
 Cote d'Ivoire
-
 Croatia
-
 Cuba
-
 Cyprus
-
 Czechia
-
 DR Congo
-
 Denmark
-
 Dominican Republic
-
 Ecuador
-
 Egypt
-
 El Salvador
-
 Estonia
-
 Eswatini
-
 Ethiopia
-
 Finland
-
 France
-
 Georgia
-
 Germany
-
 Ghana
-
 Greece
-
 Haiti
-
 Hong Kong
-
 Hungary
-
 India
-
 Indonesia
-
 Iran, Islamic republic
-
 Iraq
-
 Ireland
-
 Israel
-
 Italy
-
 Jamaica
-
 Japan
-
 Jordan
-
 Kazakhstan
-
 Kenya
-
 Korea
-
 Kuwait
-
 Kyrgyzstan
-
 Laos
-
 Latvia
-
 Lebanon
-
 Lesotho
-
 Libya
-
 Lithuania
-
 Luxembourg
-
 Madagascar
-
 Malaysia
-
 Malta
-
 Mauritius
-
 Mexico
-
 Moldova
-
 Mongolia
-
 Montenegro
-
 Morocco
-
 Mozambique
-
 Myanmar
-
 Namibia
-
 Nepal
-
 Netherlands
-
 New Zealand
-
 Nigeria
-
 North Macedonia
-
 Norway
-
 Oman
-
 Pakistan
-
 Palestine
-
 Panama
-
 Papua New Guinea
-
 Paraguay
-
 Peru
-
 Philippines
-
 Poland
-
 Portugal
-
 Puerto Rico
-
 Qatar
-
 Reunion
-
 Romania
-
 Rwanda
-
 Saudi Arabia
-
 Serbia
-
 Singapore
-
 Slovakia
-
 Slovenia
-
 Somalia
-
 South Africa
-
 Spain
-
 Sri Lanka
-
 Sweden
-
 Switzerland
-
 Syria
-
 Taiwan
-
 Tajikistan
-
 Tanzania
-
 Thailand
-
 Trinidad and Tobago
-
 Tunisia
-
 Turkey
-
 UAE
-
 Uganda
-
 Ukraine
-
 United Kingdom
-
United States
-
 Uruguay
-
 Uzbekistan
-
 Venezuela
-
 Vietnam
-
 Yemen
-
 Zambia
-
 Zimbabwe
- Forex
- Crypto












