

Broadcom stock recovery holds but faces a stretched setup: weekly analysis

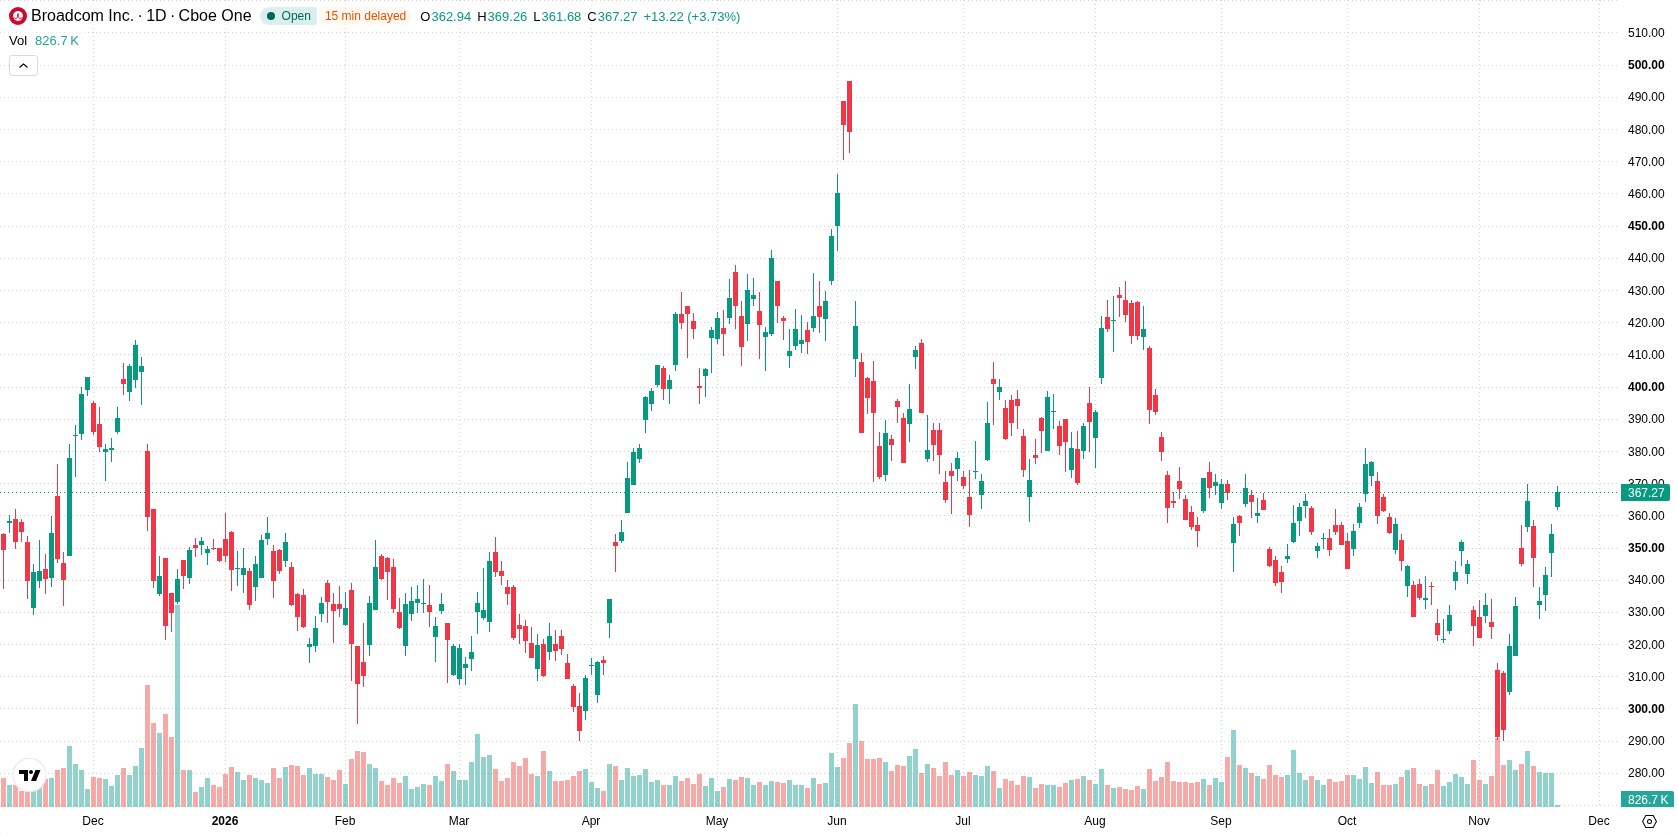
Shares of Broadcom Inc. (AVGO) are trading near $364 after climbing more than 5% over the past week. The chart highlights a recovery that has held for now, but conflicting signals and stretching technicals keep the outlook cautious for the days ahead.
 369.26
Highlights
- Shares of Broadcom gained 5.06% this week, closing at $364.27 and near the top of their recent range.
- The stock trades above short-term moving averages but remains below the 200-day, indicating a bearish long-term structure.
- Technical signals are mixed with potential overbought readings, and shares are expected to consolidate between $342.54 and $377.48 over the next five days.
AI revenue surge offsets downgrade as concentration risk tempers optimism
Broadcom has reported robust growth in its artificial intelligence semiconductor business, with Q3 AI semiconductor revenue reaching $16.7 billion, a year-over-year increase of 221%, according to FXLeaders. The company also saw its infrastructure software revenue climb by 29% to $8.75 billion and achieved a record free cash flow of $13.7 billion during the quarter. However, Seeking Alpha reports that Broadcom faces significant customer concentration risk and rising contingent liabilities tied to credit-fueled AI customer agreements, while Yahoo Finance notes a recent downgrade to Neutral by Rothschild & Co Redburn due to concerns about the sustainability of its AI revenue model.
Mixed technical signals persist as sharp gains test resistance levels
On the daily chart, price action shows a sharp move higher without a sustained trend, as reflected in flat trend strength and recent 9.01% volatility. Oscillator readings are mixed: the RSI is neutral at 55.16, while Stochastic RSI is overbought at 84.57, signaling potential near-term overheating. The nearest support is $357.34 and resistance aligns with the 200-day moving average at $367.61. The Ichimoku Kijun at $329.79 offers an additional support reference.
Consolidation likely in coming week unless breakout or support breach occurs
Over the next five trading days, Broadcom shares are expected to trade between $342.54 and $377.48, with a 61% probability of an increase and a 39% probability of a decrease. The base case points to consolidation near these levels. A bullish scenario could see a breakout above $367.61, opening up further upside. If shares drop below $357.34 support, a deeper pullback toward the lower edge of the range becomes possible.
Earlier, analysts noted that Broadcom was positioned for further gains within a defined volatility band, with upside potential contingent on technical breakouts. The latest developments add focus to risks surrounding the company's AI revenue concentration, making sustained closes above the 200-day moving average at $367.61 a key signal for ongoing bullish momentum.










-
 Afghanistan
-
 Albania
-
 Algeria
-
 Angola
-
 Argentina
-
 Armenia
-
 Australia
-
 Austria
-
 Azerbaijan
-
 Bahamas
-
 Bahrain
-
 Bangladesh
-
 Belarus
-
 Belgium
-
 Bolivia
-
 Botswana
-
 Brazil
-
 Brunei
-
 Bulgaria
-
 Cambodia
-
 Cameroon
-
 Canada
-
 Chile
-
 China
-
 Colombia
-
 Congo
-
 Costa Rica
-
 Cote d'Ivoire
-
 Croatia
-
 Cuba
-
 Cyprus
-
 Czechia
-
 DR Congo
-
 Denmark
-
 Dominican Republic
-
 Ecuador
-
 Egypt
-
 El Salvador
-
 Estonia
-
 Eswatini
-
 Ethiopia
-
 Finland
-
 France
-
 Georgia
-
 Germany
-
 Ghana
-
 Greece
-
 Haiti
-
 Hong Kong
-
 Hungary
-
 India
-
 Indonesia
-
 Iran, Islamic republic
-
 Iraq
-
 Ireland
-
 Israel
-
 Italy
-
 Jamaica
-
 Japan
-
 Jordan
-
 Kazakhstan
-
 Kenya
-
 Korea
-
 Kuwait
-
 Kyrgyzstan
-
 Laos
-
 Latvia
-
 Lebanon
-
 Lesotho
-
 Libya
-
 Lithuania
-
 Luxembourg
-
 Madagascar
-
 Malaysia
-
 Malta
-
 Mauritius
-
 Mexico
-
 Moldova
-
 Mongolia
-
 Montenegro
-
 Morocco
-
 Mozambique
-
 Myanmar
-
 Namibia
-
 Nepal
-
 Netherlands
-
 New Zealand
-
 Nigeria
-
 North Macedonia
-
 Norway
-
 Oman
-
 Pakistan
-
 Palestine
-
 Panama
-
 Papua New Guinea
-
 Paraguay
-
 Peru
-
 Philippines
-
 Poland
-
 Portugal
-
 Puerto Rico
-
 Qatar
-
 Reunion
-
 Romania
-
 Rwanda
-
 Saudi Arabia
-
 Serbia
-
 Singapore
-
 Slovakia
-
 Slovenia
-
 Somalia
-
 South Africa
-
 Spain
-
 Sri Lanka
-
 Sweden
-
 Switzerland
-
 Syria
-
 Taiwan
-
 Tajikistan
-
 Tanzania
-
 Thailand
-
 Trinidad and Tobago
-
 Tunisia
-
 Turkey
-
 UAE
-
 Uganda
-
 Ukraine
-
 United Kingdom
-
United States
-
 Uruguay
-
 Uzbekistan
-
 Venezuela
-
 Vietnam
-
 Yemen
-
 Zambia
-
 Zimbabwe
- Forex
- Crypto












