

Texas Instruments stock slides while downward price move accelerates under continued seller pressure

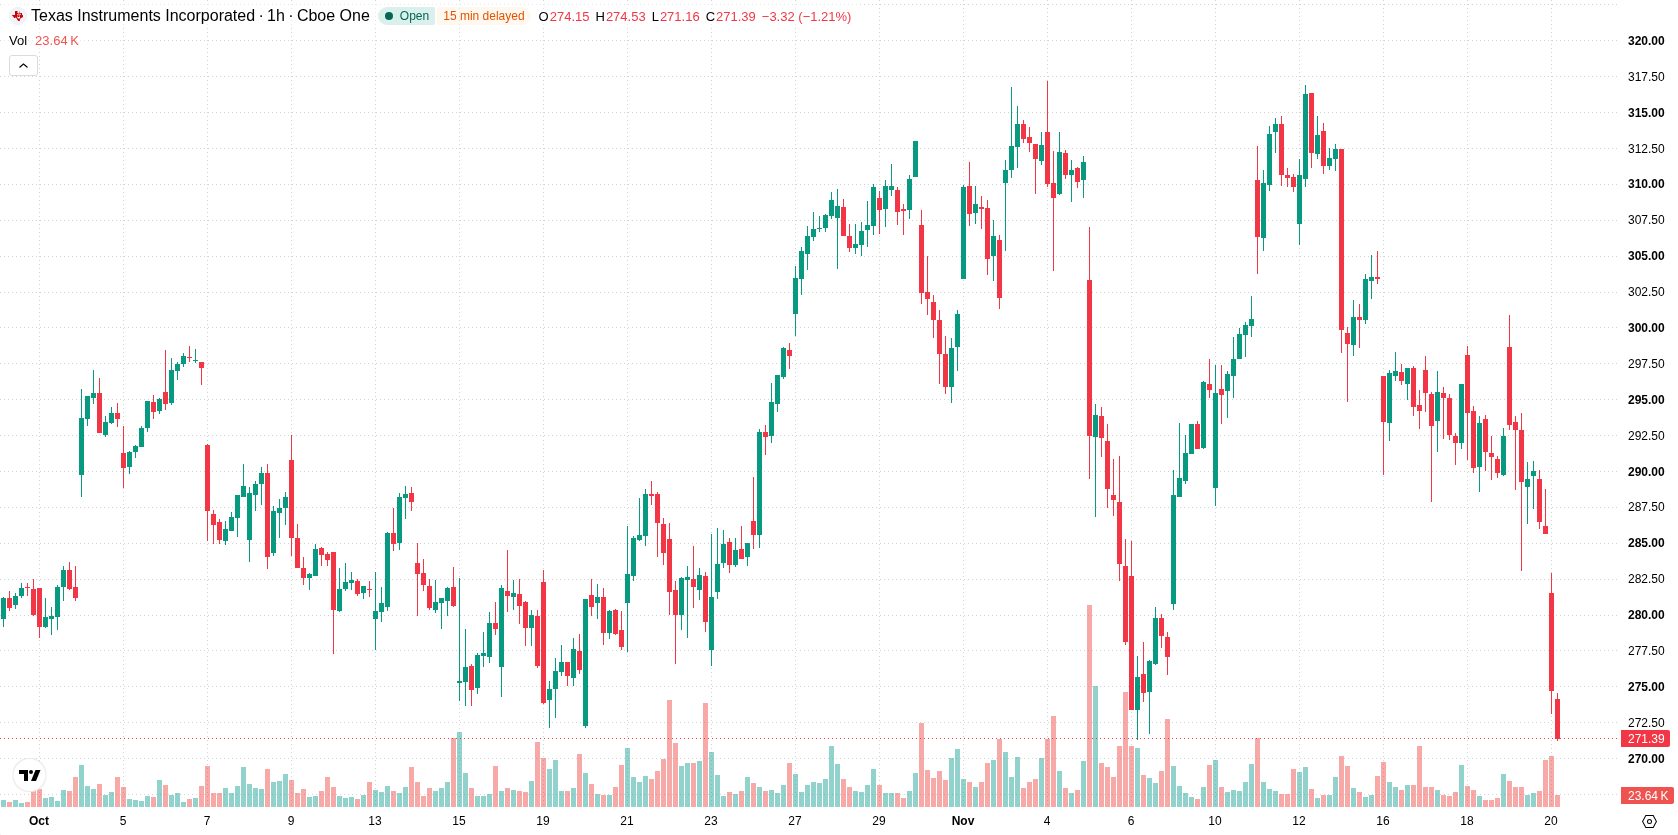
Texas Instruments (TXN) stock is trading at $273.36, down 4.34% on the day and marking a notable gap lower within a high-volatility session. The price sits below its key short-term and medium-term moving averages, while still holding above its major long-term average.
 282.55
301.00
Highlights
- TXN/USD trades below key short-term and medium-term moving averages, indicating clear selling pressure in the near term.
- Oscillators including Stoch RSI and CCI are oversold, hinting at possible selling exhaustion despite strong negative momentum signals.
- TXN/USD stands near intraday lows after a 4.34% drop, with a next-session forecast range of $265.31 to $286.2 and a higher probability of further downside.
Seller dominance persists as price nears support and oversold metrics emerge
On the technical front, TXN is trading below both H1 SMA-20 at $291.65 and H1 SMA-50 at $299.48, confirming short-term and medium-term resistance zones. The price remains supported above the D1 SMA-200 at $266.18. The Ichimoku Kijun at $291.99 serves as immediate overhead resistance. MACD signals a sell bias, while ADX is neutral, indicating ongoing but potentially uncertain momentum. RSI sits within the neutral zone, but Stoch RSI and CCI are both in oversold territory, suggesting that selling exhaustion may be emerging. Bull/Bear Power is negative at -1.85, supporting continued dominance by sellers intraday, and the Awesome Oscillator points down. The asset is trading near the low end of its intraday range, with high volatility and conflicting signals from momentum versus oversold oscillators.
Further downside likely as narrow range caps reversal hopes
For the short term, TXN is expected to trade within a volatility band defined by $265.31 on the downside and $286.2 on the upside over the next several sessions. The likelihood of an upward reversal is very low, with the prevailing bias favoring further downside pressure. The baseline scenario is for the price to remain in a sideways consolidation. A break above $291.99 could point to a bullish reversal, while a drop below $265.31 would likely confirm a renewed leg down in the existing downtrend.
Earlier, analysts noted that Texas Instruments was facing heightened selling pressure, with its stock positioned below key short- and medium-term moving averages but retaining some longer-term support. The latest price action confirms an ongoing downside bias, with heightened volatility and oversold signals making the $265.31 support a critical level to monitor for any potential escalation in weakness.






Latest Texas Instruments News




-
 Afghanistan
-
 Albania
-
 Algeria
-
 Angola
-
 Argentina
-
 Armenia
-
 Australia
-
 Austria
-
 Azerbaijan
-
 Bahamas
-
 Bahrain
-
 Bangladesh
-
 Belarus
-
 Belgium
-
 Bolivia
-
 Botswana
-
 Brazil
-
 Brunei
-
 Bulgaria
-
 Cambodia
-
 Cameroon
-
 Canada
-
 Chile
-
 China
-
 Colombia
-
 Congo
-
 Costa Rica
-
 Cote d'Ivoire
-
 Croatia
-
 Cuba
-
 Cyprus
-
 Czechia
-
 DR Congo
-
 Denmark
-
 Dominican Republic
-
 Ecuador
-
 Egypt
-
 El Salvador
-
 Estonia
-
 Eswatini
-
 Ethiopia
-
 Finland
-
 France
-
 Georgia
-
 Germany
-
 Ghana
-
 Greece
-
 Haiti
-
 Hong Kong
-
 Hungary
-
 India
-
 Indonesia
-
 Iran, Islamic republic
-
 Iraq
-
 Ireland
-
 Israel
-
 Italy
-
 Jamaica
-
 Japan
-
 Jordan
-
 Kazakhstan
-
 Kenya
-
 Korea
-
 Kuwait
-
 Kyrgyzstan
-
 Laos
-
 Latvia
-
 Lebanon
-
 Lesotho
-
 Libya
-
 Lithuania
-
 Luxembourg
-
 Madagascar
-
 Malaysia
-
 Malta
-
 Mauritius
-
 Mexico
-
 Moldova
-
 Mongolia
-
 Montenegro
-
 Morocco
-
 Mozambique
-
 Myanmar
-
 Namibia
-
 Nepal
-
 Netherlands
-
 New Zealand
-
 Nigeria
-
 North Macedonia
-
 Norway
-
 Oman
-
 Pakistan
-
 Palestine
-
 Panama
-
 Papua New Guinea
-
 Paraguay
-
 Peru
-
 Philippines
-
 Poland
-
 Portugal
-
 Puerto Rico
-
 Qatar
-
 Reunion
-
 Romania
-
 Rwanda
-
 Saudi Arabia
-
 Serbia
-
 Singapore
-
 Slovakia
-
 Slovenia
-
 Somalia
-
 South Africa
-
 Spain
-
 Sri Lanka
-
 Sweden
-
 Switzerland
-
 Syria
-
 Taiwan
-
 Tajikistan
-
 Tanzania
-
 Thailand
-
 Trinidad and Tobago
-
 Tunisia
-
 Turkey
-
 UAE
-
 Uganda
-
 Ukraine
-
 United Kingdom
-
United States
-
 Uruguay
-
 Uzbekistan
-
 Venezuela
-
 Vietnam
-
 Yemen
-
 Zambia
-
 Zimbabwe
- Forex
- Crypto












