

Walmart Q3 revenue and ad gains: Can WMT sustain bullish momentum?

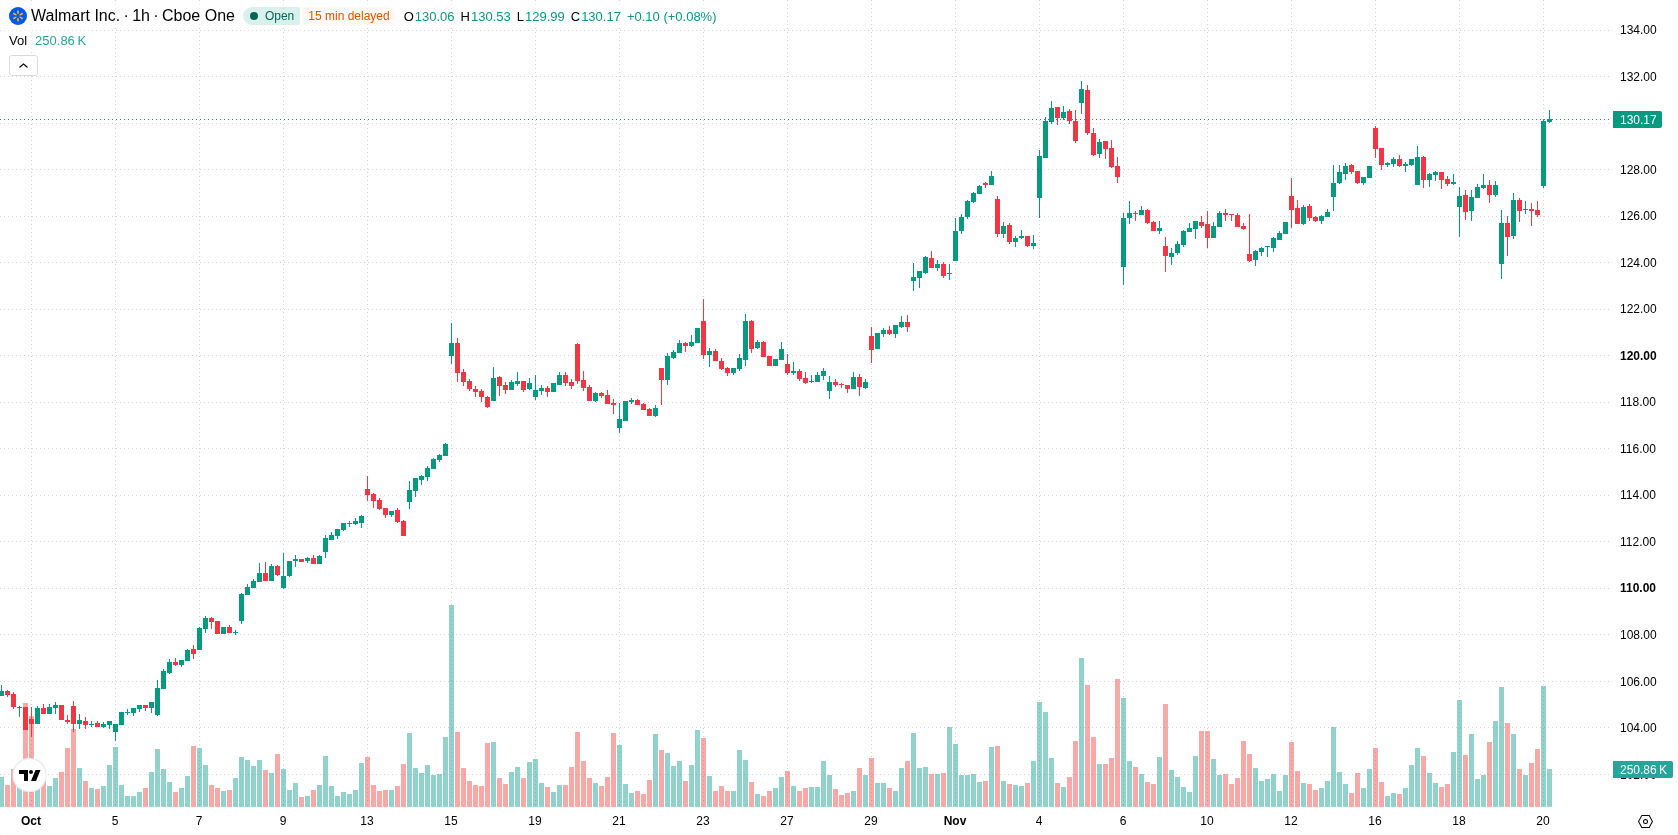
Walmart (WMT) stock is trading at $130.14, gaining 3.25% on the day. The price sits above its key short- and medium-term moving averages, reflecting ongoing bullish momentum relative to recent technical benchmarks.
 129.75
129.84
Highlights
- Walmart stock rose after quarterly revenue increased 5.2% to $188.8 billion and U.S. e-commerce sales grew 23%.
- Management increased full-year adjusted EPS guidance to $2.84 to $2.89 with operating income up 5.5% and global ad revenue rising 25%.
- Walmart stock is trading in a short- and medium-term bullish structure with a projected range of $126.81 to $133.08 and 65% upside probability.
Stronger earnings and digital growth fuel management confidence
Walmart posted stronger-than-expected third-quarter fiscal 2027 results, with revenue rising 5.2% year-over-year to $188.8 billion and U.S. e-commerce sales climbing 23%, highlighting robust demand and digital expansion. Management raised its full-year adjusted EPS guidance to $2.84–$2.89, signaling sustained confidence in operating momentum, according to Coinpaper. Additional gains came from a 4.4% increase in global sales and a 5.5% uptick in adjusted operating income, as reported by Gurufocus, while Yahoo Finance noted a 25% rise in global advertising revenue and substantial growth in U.S. ad sales, supported by new digital media tools.
Mixed momentum signals as price sits firmly above support
On the technical front, WMT is trading above the H1 SMA-20 at $126.84 and H1 SMA-50 at $126.8, as well as well above the D1 SMA-200 at $118.98. The immediate support is defined by the Ichimoku Kijun at $126.14, reinforcing a key near-term floor. Momentum indicators present a complex picture: MACD and ADX signal sell conditions, while RSI, Stoch RSI, and CCI are neutral in their current ranges. Bull/Bear Power stands slightly positive at 0.09, reflecting a marginally favorable situation for buyers on the intraday timeframe.
Upside favored as consolidation persists within defined range
Looking ahead, the next several days are likely to see WMT consolidate within a forecasted range of $126.81 to $133.08. Probabilities favor a move higher, with a 65% chance assigned to the upside scenario and 35% to the downside. In the baseline scenario, price holds within this corridor. A breakout above resistance would open the upper range, while a drop below support would shift attention toward the lower boundary and signal weakening bullish momentum.
Earlier, analysts noted that a wave of technology-related disruptions in the U.S. spurred increased demand for emergency supplies at major retailers like Walmart. The current technical and earnings backdrop suggests traders should monitor the $126.81 support and $133.08 resistance, as a break beyond either could define Walmart’s next directional move.











-
 Afghanistan
-
 Albania
-
 Algeria
-
 Angola
-
 Argentina
-
 Armenia
-
 Australia
-
 Austria
-
 Azerbaijan
-
 Bahamas
-
 Bahrain
-
 Bangladesh
-
 Belarus
-
 Belgium
-
 Bolivia
-
 Botswana
-
 Brazil
-
 Brunei
-
 Bulgaria
-
 Cambodia
-
 Cameroon
-
 Canada
-
 Chile
-
 China
-
 Colombia
-
 Congo
-
 Costa Rica
-
 Cote d'Ivoire
-
 Croatia
-
 Cuba
-
 Cyprus
-
 Czechia
-
 DR Congo
-
 Denmark
-
 Dominican Republic
-
 Ecuador
-
 Egypt
-
 El Salvador
-
 Estonia
-
 Eswatini
-
 Ethiopia
-
 Finland
-
 France
-
 Georgia
-
 Germany
-
 Ghana
-
 Greece
-
 Haiti
-
 Hong Kong
-
 Hungary
-
 India
-
 Indonesia
-
 Iran, Islamic republic
-
 Iraq
-
 Ireland
-
 Israel
-
 Italy
-
 Jamaica
-
 Japan
-
 Jordan
-
 Kazakhstan
-
 Kenya
-
 Korea
-
 Kuwait
-
 Kyrgyzstan
-
 Laos
-
 Latvia
-
 Lebanon
-
 Lesotho
-
 Libya
-
 Lithuania
-
 Luxembourg
-
 Madagascar
-
 Malaysia
-
 Malta
-
 Mauritius
-
 Mexico
-
 Moldova
-
 Mongolia
-
 Montenegro
-
 Morocco
-
 Mozambique
-
 Myanmar
-
 Namibia
-
 Nepal
-
 Netherlands
-
 New Zealand
-
 Nigeria
-
 North Macedonia
-
 Norway
-
 Oman
-
 Pakistan
-
 Palestine
-
 Panama
-
 Papua New Guinea
-
 Paraguay
-
 Peru
-
 Philippines
-
 Poland
-
 Portugal
-
 Puerto Rico
-
 Qatar
-
 Reunion
-
 Romania
-
 Rwanda
-
 Saudi Arabia
-
 Serbia
-
 Singapore
-
 Slovakia
-
 Slovenia
-
 Somalia
-
 South Africa
-
 Spain
-
 Sri Lanka
-
 Sweden
-
 Switzerland
-
 Syria
-
 Taiwan
-
 Tajikistan
-
 Tanzania
-
 Thailand
-
 Trinidad and Tobago
-
 Tunisia
-
 Turkey
-
 UAE
-
 Uganda
-
 Ukraine
-
 United Kingdom
-
United States
-
 Uruguay
-
 Uzbekistan
-
 Venezuela
-
 Vietnam
-
 Yemen
-
 Zambia
-
 Zimbabwe
- Forex
- Crypto












