

What's behind Barrick Gold's latest 4.8% stock pullback?

Barrick Gold Corporation (ABX) slumped 4.84% following earnings and strategic moves, even as its strong third-quarter results and announced dividend set a positive fundamental backdrop. The down move is supported by sustained technical weakness, with the stock trading below all major moving averages and trapped between firm resistance and a lower volatility band.
 49.64
54.05
Highlights
- Barrick Gold posted a 22% year-over-year rise in both revenue and adjusted EBITDA for Q3 2026, with adjusted earnings of $0.82 per share.
- The company affirmed its full-year 2026 gold production guidance, declared a $0.175 per share dividend, and registered for the IPO of its North American gold assets.
- Barrick Gold stock trades below key moving averages under broad selling pressure, with a projected five-day range of C$42.48 to C$48.71 and momentum indicators pointing to a bearish or sideways trend.
Positive earnings and asset moves met with persistent selling pressure
Barrick Gold reported a 22% year-over-year increase in both revenue and adjusted EBITDA for the third quarter of 2026, with adjusted earnings of $0.82 per share. The company maintained its full-year 2026 gold production guidance and declared a dividend of $0.175 per share, payable on December 15, 2026. Barrick also exercised its anti-dilution rights by subscribing for new Hercules Metals shares and filed an S-1 registration for the planned IPO of its North American gold assets. Operational adjustments and enhanced health protocols were implemented at the Kibali mine following local Ebola cases, though price action has remained under broader selling pressure.
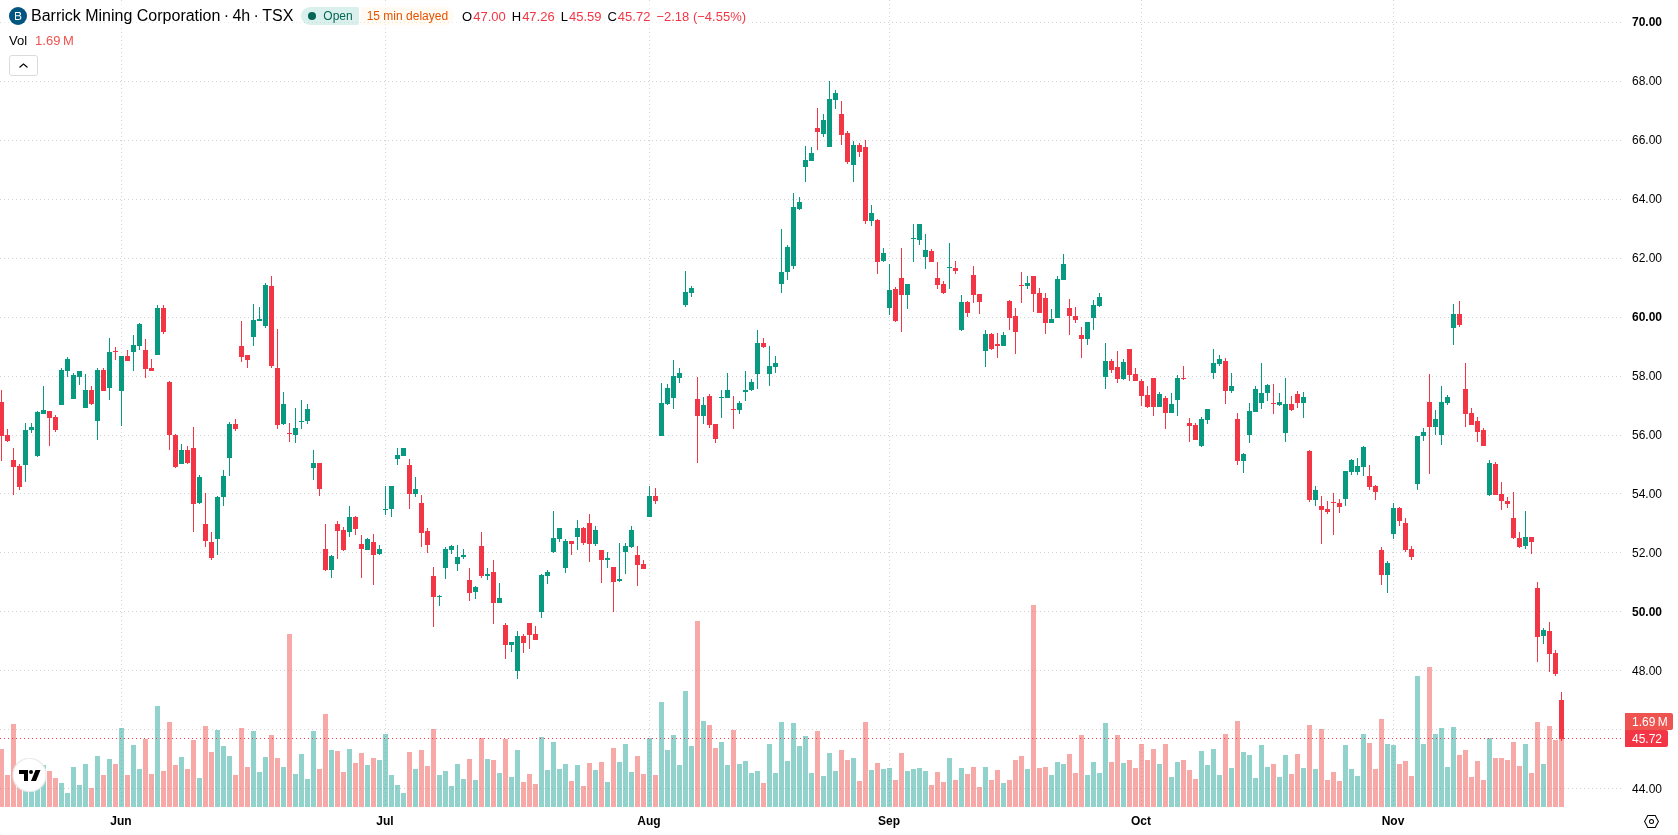
Bearish momentum deepens as stock breaches key technical support
ABX is trading below its 20-day, 50-day, and 200-day moving averages (C$54, C$56.62, and C$57.58, respectively), indicating seller dominance across all timeframes. The near-term resistance is marked at C$47.82, with a support floor at C$42.48. Momentum remains weak, with MACD signaling a bearish structure and an ADX reading of 18.38 confirming the absence of a strong directional trend. The Relative Strength Index is neutral, but the Stochastic RSI and Commodity Channel Index are in the oversold zone, highlighting potential selling exhaustion. Bull/Bear Power at -3.39 and negative signals from both the Awesome Oscillator and HMA continue to align with persistent downside pressure.
Earlier, analysts noted that Barrick Gold’s shares remained under pronounced technical pressure despite improved operational performance. The latest results reinforce this view, with persistent downside momentum suggesting that monitoring the C$42.48 support level remains critical in assessing further risk.






Latest Barrick Gold News




-
 Afghanistan
-
 Albania
-
 Algeria
-
 Angola
-
 Argentina
-
 Armenia
-
 Australia
-
 Austria
-
 Azerbaijan
-
 Bahamas
-
 Bahrain
-
 Bangladesh
-
 Belarus
-
 Belgium
-
 Bolivia
-
 Botswana
-
 Brazil
-
 Brunei
-
 Bulgaria
-
 Cambodia
-
 Cameroon
-
 Canada
-
 Chile
-
 China
-
 Colombia
-
 Congo
-
 Costa Rica
-
 Cote d'Ivoire
-
 Croatia
-
 Cuba
-
 Cyprus
-
 Czechia
-
 DR Congo
-
 Denmark
-
 Dominican Republic
-
 Ecuador
-
 Egypt
-
 El Salvador
-
 Estonia
-
 Eswatini
-
 Ethiopia
-
 Finland
-
 France
-
 Georgia
-
 Germany
-
 Ghana
-
 Greece
-
 Haiti
-
 Hong Kong
-
 Hungary
-
 India
-
 Indonesia
-
 Iran, Islamic republic
-
 Iraq
-
 Ireland
-
 Israel
-
 Italy
-
 Jamaica
-
 Japan
-
 Jordan
-
 Kazakhstan
-
 Kenya
-
 Korea
-
 Kuwait
-
 Kyrgyzstan
-
 Laos
-
 Latvia
-
 Lebanon
-
 Lesotho
-
 Libya
-
 Lithuania
-
 Luxembourg
-
 Madagascar
-
 Malaysia
-
 Malta
-
 Mauritius
-
 Mexico
-
 Moldova
-
 Mongolia
-
 Montenegro
-
 Morocco
-
 Mozambique
-
 Myanmar
-
 Namibia
-
 Nepal
-
 Netherlands
-
 New Zealand
-
 Nigeria
-
 North Macedonia
-
 Norway
-
 Oman
-
 Pakistan
-
 Palestine
-
 Panama
-
 Papua New Guinea
-
 Paraguay
-
 Peru
-
 Philippines
-
 Poland
-
 Portugal
-
 Puerto Rico
-
 Qatar
-
 Reunion
-
 Romania
-
 Rwanda
-
 Saudi Arabia
-
 Serbia
-
 Singapore
-
 Slovakia
-
 Slovenia
-
 Somalia
-
 South Africa
-
 Spain
-
 Sri Lanka
-
 Sweden
-
 Switzerland
-
 Syria
-
 Taiwan
-
 Tajikistan
-
 Tanzania
-
 Thailand
-
 Trinidad and Tobago
-
 Tunisia
-
 Turkey
-
 UAE
-
 Uganda
-
 Ukraine
-
 United Kingdom
-
United States
-
 Uruguay
-
 Uzbekistan
-
 Venezuela
-
 Vietnam
-
 Yemen
-
 Zambia
-
 Zimbabwe
- Forex
- Crypto












