

Morgan Stanley stock outlook: Bearish bias persists as seller pressure outweighs oversold signals

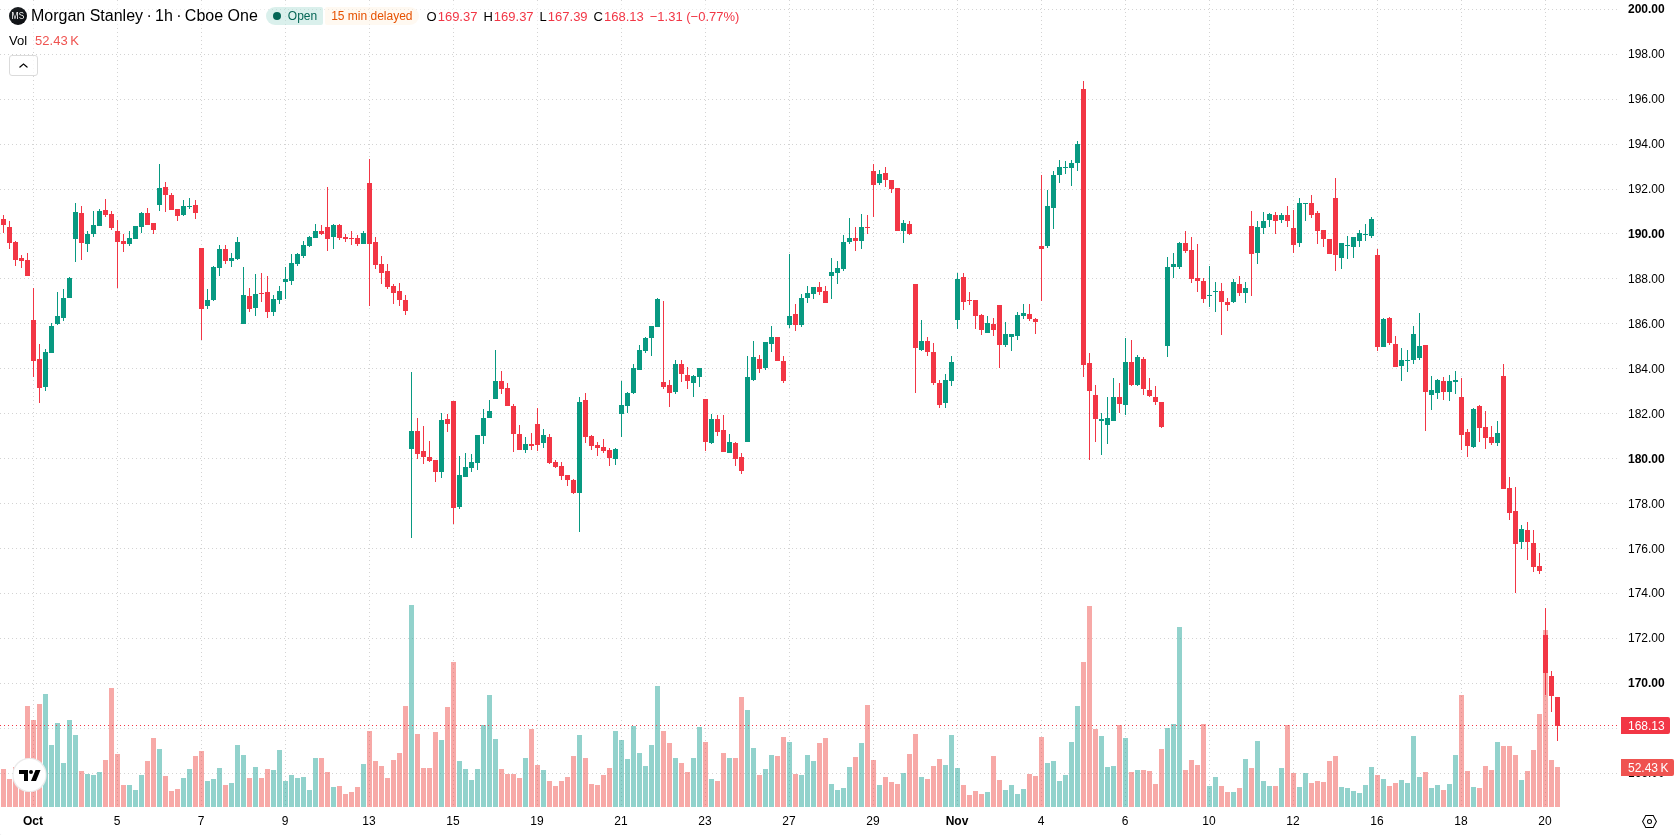
Morgan Stanley (MS) stock is trading at $167.99 after a 4% decline on the session. The stock remains below its key moving averages, reflecting notable short-term and longer-term downside pressure.
 173.40
189.31
Highlights
- Morgan Stanley has introduced four actively managed Ireland-based UCITS ETFs in Europe, targeting long-term thematic investment strategies.
- Expanding its European ETF platform supports Morgan Stanley's exposure to regulated markets and diversifies its future revenue sources.
- Shares of Morgan Stanley fell 4% to $167.99 under strong downside momentum, with technical indicators confirming elevated selling pressure and a forecast range of $161.14 to $174.84 over the next 2 to 3 days.
European ETF launch broadens revenue base amid selling pressure
Morgan Stanley has completed the launch of its active ETF platform in Europe, marking the debut of four Ireland-domiciled UCITS ETFs aimed at long-term thematic and actively managed strategies for investors outside the U.S., according to Yahoo Finance. By broadening its product lineup, the bank is increasing its exposure to European asset management and diversifying its revenue sources in regulated markets. While this step enhances future growth potential tied to expansive investment vehicles, price action has remained under broader selling pressure.
Downward bias persists as indicators signal extended negative momentum
The price has traded below the H1 SMA-20 at $180.16, H1 SMA-50 at $185.28, and D1 SMA-200 at $194.49, highlighting a downward bias across all referenced timeframes. The Ichimoku Kijun at $180.23 is identified as immediate resistance for any rebound. Momentum and trend indicators are negative, with MACD and ADX both showing a sell bias. RSI, Stoch RSI, and CCI sit in their oversold zones, suggesting potential for a near-term bounce, though no reversal is confirmed. Bull/Bear Power is measured at –2.51, indicating persistent seller dominance, and the Awesome Oscillator aligns with the intraday sell tone.
Downside risk prevails as volatility defines near-term boundaries
In the short term, the expected price range for MS over the next 2–3 trading days is $161.14 to $174.84, reflecting a typical volatility corridor relative to current levels. There is a 25% probability of an upside move; however, further downside remains the more likely scenario within this range. The baseline expectation is for price to remain between support at $161.14 and resistance at $174.84. A bullish scenario would require price to break above the immediate resistance, while a bearish scenario may develop if support at the lower end of the band fails.
Earlier, analysts noted that Morgan Stanley shares were exhibiting a persistent bearish trend with sustained selling pressure. The current analysis reinforces this cautious outlook, with technical signals continuing to indicate downside risks while traders should closely monitor for any decisive break above the identified resistance to gauge a potential reversal.











-
 Afghanistan
-
 Albania
-
 Algeria
-
 Angola
-
 Argentina
-
 Armenia
-
 Australia
-
 Austria
-
 Azerbaijan
-
 Bahamas
-
 Bahrain
-
 Bangladesh
-
 Belarus
-
 Belgium
-
 Bolivia
-
 Botswana
-
 Brazil
-
 Brunei
-
 Bulgaria
-
 Cambodia
-
 Cameroon
-
 Canada
-
 Chile
-
 China
-
 Colombia
-
 Congo
-
 Costa Rica
-
 Cote d'Ivoire
-
 Croatia
-
 Cuba
-
 Cyprus
-
 Czechia
-
 DR Congo
-
 Denmark
-
 Dominican Republic
-
 Ecuador
-
 Egypt
-
 El Salvador
-
 Estonia
-
 Eswatini
-
 Ethiopia
-
 Finland
-
 France
-
 Georgia
-
 Germany
-
 Ghana
-
 Greece
-
 Haiti
-
 Hong Kong
-
 Hungary
-
 India
-
 Indonesia
-
 Iran, Islamic republic
-
 Iraq
-
 Ireland
-
 Israel
-
 Italy
-
 Jamaica
-
 Japan
-
 Jordan
-
 Kazakhstan
-
 Kenya
-
 Korea
-
 Kuwait
-
 Kyrgyzstan
-
 Laos
-
 Latvia
-
 Lebanon
-
 Lesotho
-
 Libya
-
 Lithuania
-
 Luxembourg
-
 Madagascar
-
 Malaysia
-
 Malta
-
 Mauritius
-
 Mexico
-
 Moldova
-
 Mongolia
-
 Montenegro
-
 Morocco
-
 Mozambique
-
 Myanmar
-
 Namibia
-
 Nepal
-
 Netherlands
-
 New Zealand
-
 Nigeria
-
 North Macedonia
-
 Norway
-
 Oman
-
 Pakistan
-
 Palestine
-
 Panama
-
 Papua New Guinea
-
 Paraguay
-
 Peru
-
 Philippines
-
 Poland
-
 Portugal
-
 Puerto Rico
-
 Qatar
-
 Reunion
-
 Romania
-
 Rwanda
-
 Saudi Arabia
-
 Serbia
-
 Singapore
-
 Slovakia
-
 Slovenia
-
 Somalia
-
 South Africa
-
 Spain
-
 Sri Lanka
-
 Sweden
-
 Switzerland
-
 Syria
-
 Taiwan
-
 Tajikistan
-
 Tanzania
-
 Thailand
-
 Trinidad and Tobago
-
 Tunisia
-
 Turkey
-
 UAE
-
 Uganda
-
 Ukraine
-
 United Kingdom
-
United States
-
 Uruguay
-
 Uzbekistan
-
 Venezuela
-
 Vietnam
-
 Yemen
-
 Zambia
-
 Zimbabwe
- Forex
- Crypto












