

Marathon Digital hits 52-week low and shrinks market cap: MARA remains under pressure

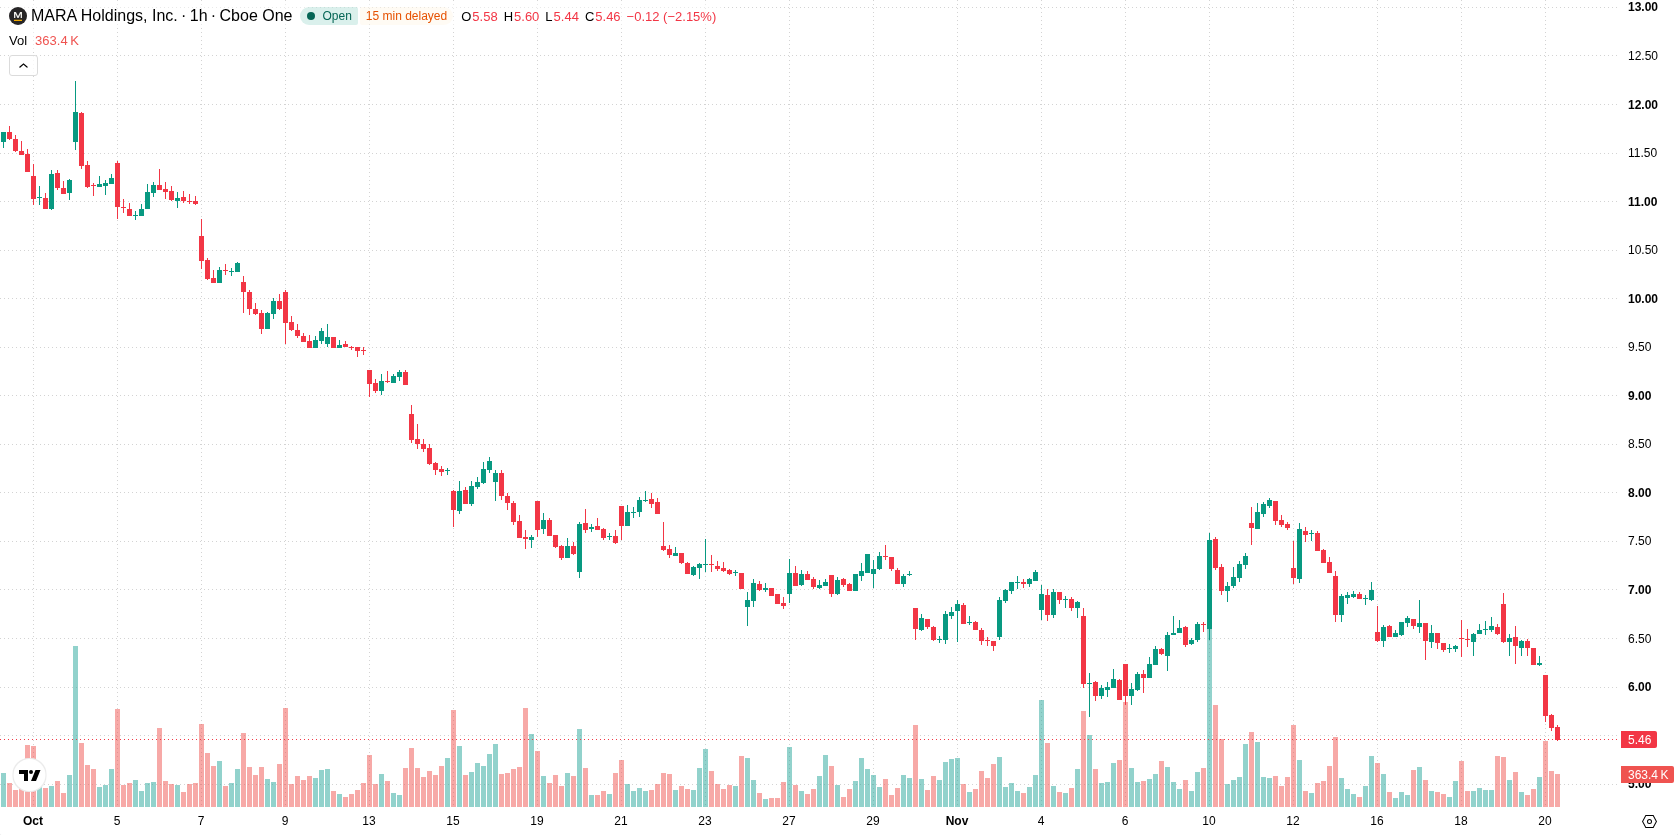
Marathon Digital (MARA) stock is trading at $5.45, marking a daily decline of 12.8%. The price remains below its key moving averages, highlighting ongoing weakness relative to recent trend benchmarks.
 6.11
6.97
Highlights
- Shares of Marathon Digital reached a new 52-week low, with market capitalization contracting to $2.25 billion.
- Ongoing selling pressure throughout the year has increased awareness of the stock's vulnerability to further declines.
- MARA/USD trades below key moving averages with indicators in oversold zones; expected price range is $5.11 to $6.33 over the next 2 to 3 days, with high probability of continued downside.
Stock vulnerability rises as 52-week low triggers caution
Marathon Digital recently recorded a new 52-week low, an event that typically underscores broad investor caution and can further erode market sentiment. The company’s market capitalization has now contracted to $2.25 billion, according to Investing.com, reflecting the cumulative impact of ongoing selling pressure throughout the year. These developments have amplified market awareness of the stock’s vulnerability to further downside in the current environment.
Bearish momentum persists as oversold signals challenge resistance
H1 SMA-20 at $6.38, H1 SMA-50 at $6.81, and D1 SMA-200 at $10.56 are all positioned above the current price, confirming a sustained technical breakdown across short, medium, and long-term timeframes. Immediate resistance is defined by the Ichimoku Kijun at $6.26. Momentum signals are decisively negative, with MACD maintaining a sell indication and ADX in a neutral trend strength state. RSI, Stoch RSI, and CCI each register in the oversold range, suggesting potential exhaustion of sellers but no clear reversal. Bull/Bear Power remains negative at -0.51, while the Awesome Oscillator continues to support a bearish technical bias. The combination of oversold oscillators and entrenched negative momentum results in mixed technical signals.
Downside risk prevails as volatility confines price range
In the short term, MARA is expected to remain volatile within a range of $5.11 to $6.33, corresponding to recent session extremes. The probability of a move higher remains very low, while further declines remain highly probable unless a sustained break above $6.26 occurs. Under typical volatility conditions, price is likely to be confined within this corridor, with a bearish scenario favored if support near $5.11 fails.
Previously, analysts noted that Marathon Digital’s stock was experiencing persistent technical weakness and remained under pressure despite improvements in liquidity and strategic initiatives. The current article substantiates this bearish outlook, highlighting the importance of monitoring support near $5.11 as a potential trigger for further downside risk.









-
 Afghanistan
-
 Albania
-
 Algeria
-
 Angola
-
 Argentina
-
 Armenia
-
 Australia
-
 Austria
-
 Azerbaijan
-
 Bahamas
-
 Bahrain
-
 Bangladesh
-
 Belarus
-
 Belgium
-
 Bolivia
-
 Botswana
-
 Brazil
-
 Brunei
-
 Bulgaria
-
 Cambodia
-
 Cameroon
-
 Canada
-
 Chile
-
 China
-
 Colombia
-
 Congo
-
 Costa Rica
-
 Cote d'Ivoire
-
 Croatia
-
 Cuba
-
 Cyprus
-
 Czechia
-
 DR Congo
-
 Denmark
-
 Dominican Republic
-
 Ecuador
-
 Egypt
-
 El Salvador
-
 Estonia
-
 Eswatini
-
 Ethiopia
-
 Finland
-
 France
-
 Georgia
-
 Germany
-
 Ghana
-
 Greece
-
 Haiti
-
 Hong Kong
-
 Hungary
-
 India
-
 Indonesia
-
 Iran, Islamic republic
-
 Iraq
-
 Ireland
-
 Israel
-
 Italy
-
 Jamaica
-
 Japan
-
 Jordan
-
 Kazakhstan
-
 Kenya
-
 Korea
-
 Kuwait
-
 Kyrgyzstan
-
 Laos
-
 Latvia
-
 Lebanon
-
 Lesotho
-
 Libya
-
 Lithuania
-
 Luxembourg
-
 Madagascar
-
 Malaysia
-
 Malta
-
 Mauritius
-
 Mexico
-
 Moldova
-
 Mongolia
-
 Montenegro
-
 Morocco
-
 Mozambique
-
 Myanmar
-
 Namibia
-
 Nepal
-
 Netherlands
-
 New Zealand
-
 Nigeria
-
 North Macedonia
-
 Norway
-
 Oman
-
 Pakistan
-
 Palestine
-
 Panama
-
 Papua New Guinea
-
 Paraguay
-
 Peru
-
 Philippines
-
 Poland
-
 Portugal
-
 Puerto Rico
-
 Qatar
-
 Reunion
-
 Romania
-
 Rwanda
-
 Saudi Arabia
-
 Serbia
-
 Singapore
-
 Slovakia
-
 Slovenia
-
 Somalia
-
 South Africa
-
 Spain
-
 Sri Lanka
-
 Sweden
-
 Switzerland
-
 Syria
-
 Taiwan
-
 Tajikistan
-
 Tanzania
-
 Thailand
-
 Trinidad and Tobago
-
 Tunisia
-
 Turkey
-
 UAE
-
 Uganda
-
 Ukraine
-
 United Kingdom
-
United States
-
 Uruguay
-
 Uzbekistan
-
 Venezuela
-
 Vietnam
-
 Yemen
-
 Zambia
-
 Zimbabwe
- Forex
- Crypto












