

Strategy shares technical analysis: Seller pressure dominates after sharp price drop

Strategy (MSTR, formerly MicroStrategy) stock is trading at $81.37 after falling sharply by 5.59% today. The stock sits below its short- and long-term moving averages, reflecting ongoing price weakness across timeframes.
 87.83
105.79
Highlights
- Strategy Inc. completed a $3 billion buyback of STRC preferred stock, altering its capital structure and redirecting capital allocation.
- Share count dilution and focus on buybacks over Bitcoin holdings raised concerns about future per-share performance metrics.
- Shares of Strategy Inc. face strong downward pressure with bearish technical signals and a projected trading range of $72.53 to $90.21.
Outflows and dilution rise as buybacks reshape capital structure
Strategy Inc. executed a substantial $3 billion buyback of its STRC preferred stock, a move that reallocated available capital and altered the company's capital structure, according to Benzinga. Most proceeds from recent offerings have gone toward these buybacks rather than increasing Bitcoin holdings, resulting in share count dilution and raising concerns over future per-share metrics, as highlighted by Cryptobriefing. Additionally, Strategy Inc. was removed from MSCI’s USA and World Indexes after November 30, which generally triggers mandatory outflows from passive funds and intensifies selling pressure on the stock, with Fool reporting this development.
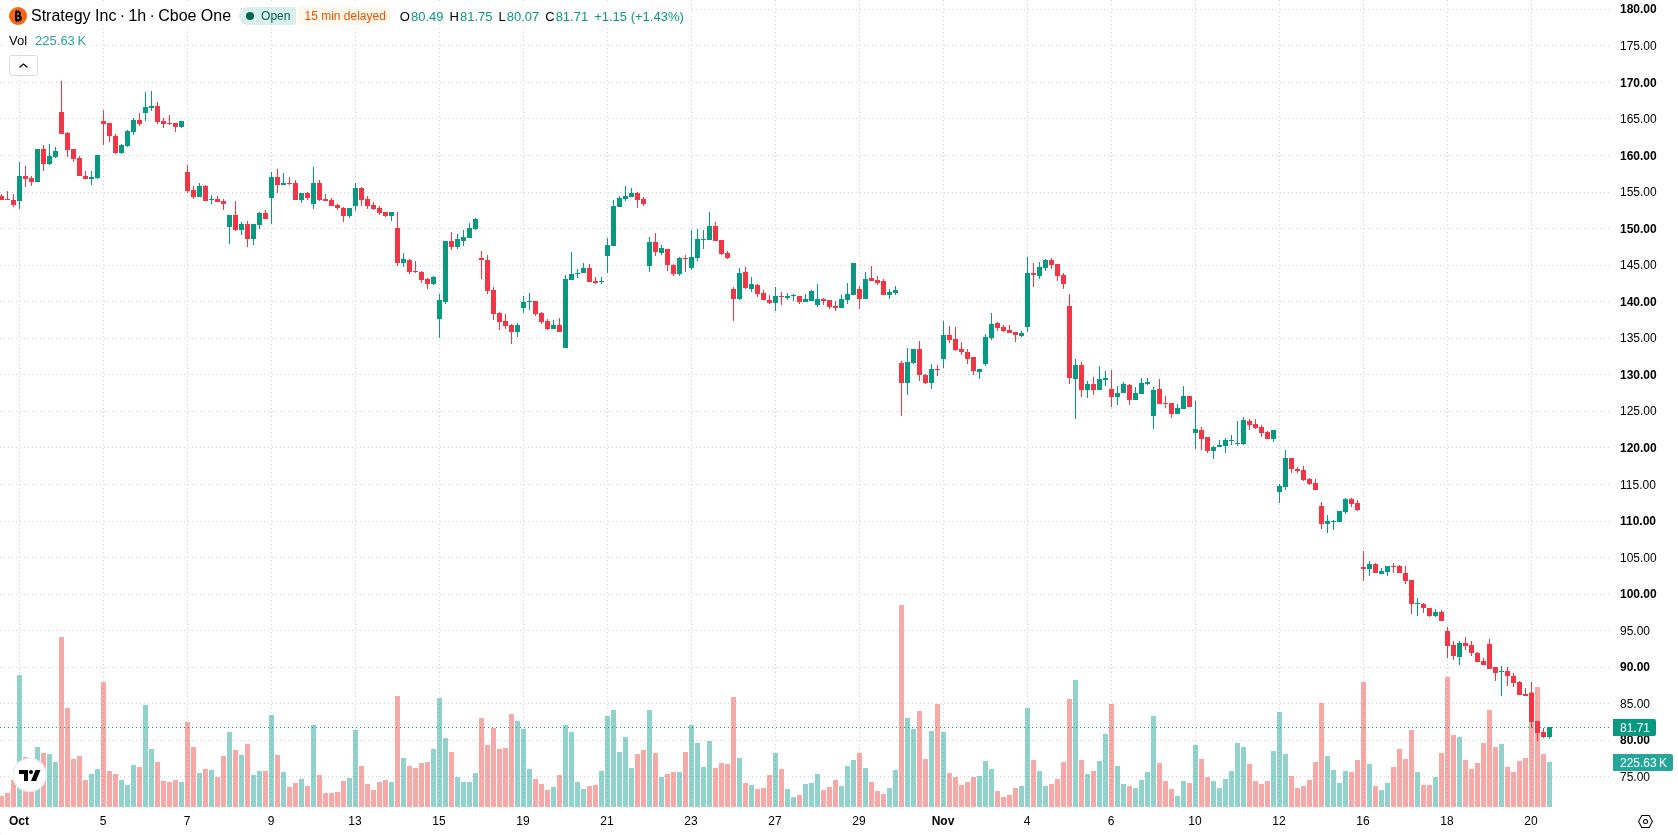
Dominant selling and oversold conditions cap rebound hopes
Technically, MSTR is trading below the H1 SMA-20 at $90.74, the H1 SMA-50 at $103.28, and the D1 SMA-200 at $131.9. The Ichimoku Kijun level at $91.98 serves as immediate resistance. Momentum indicators are deeply oversold, with RSI, Stoch RSI, and CCI all in oversold territory—potentially suggesting recent selling exhaustion but providing no confirmation of a rebound. MACD and ADX both remain on strong Sell signals, and Bull/Bear Power is negative at -5.61, indicating dominance of sellers in intraday action. Awesome Oscillator is neutral, confirming the intraday bearish tone amid elevated volatility.
Downside risk persists with volatility and weak momentum
In the near term, the probability of further downside in MSTR remains very high. Price is projected to remain within a volatility band between $72.53 and $90.21 over the next several days, barring a significant change in momentum. A move above resistance at $91.98 would be required to shift the outlook in favor of a bullish scenario. Conversely, if sellers intensify, price could break below $72.53, opening the path to deeper declines.
Earlier, analysts noted that Strategy shares remained under pronounced technical pressure and continued to face selling due to concerns around buybacks and index removals. The current analysis strengthens that view, highlighting that with intensified sell signals and structural headwinds, traders should closely monitor the $91.98 resistance level for any indication of bullish reversal.










-
 Afghanistan
-
 Albania
-
 Algeria
-
 Angola
-
 Argentina
-
 Armenia
-
 Australia
-
 Austria
-
 Azerbaijan
-
 Bahamas
-
 Bahrain
-
 Bangladesh
-
 Belarus
-
 Belgium
-
 Bolivia
-
 Botswana
-
 Brazil
-
 Brunei
-
 Bulgaria
-
 Cambodia
-
 Cameroon
-
 Canada
-
 Chile
-
 China
-
 Colombia
-
 Congo
-
 Costa Rica
-
 Cote d'Ivoire
-
 Croatia
-
 Cuba
-
 Cyprus
-
 Czechia
-
 DR Congo
-
 Denmark
-
 Dominican Republic
-
 Ecuador
-
 Egypt
-
 El Salvador
-
 Estonia
-
 Eswatini
-
 Ethiopia
-
 Finland
-
 France
-
 Georgia
-
 Germany
-
 Ghana
-
 Greece
-
 Haiti
-
 Hong Kong
-
 Hungary
-
 India
-
 Indonesia
-
 Iran, Islamic republic
-
 Iraq
-
 Ireland
-
 Israel
-
 Italy
-
 Jamaica
-
 Japan
-
 Jordan
-
 Kazakhstan
-
 Kenya
-
 Korea
-
 Kuwait
-
 Kyrgyzstan
-
 Laos
-
 Latvia
-
 Lebanon
-
 Lesotho
-
 Libya
-
 Lithuania
-
 Luxembourg
-
 Madagascar
-
 Malaysia
-
 Malta
-
 Mauritius
-
 Mexico
-
 Moldova
-
 Mongolia
-
 Montenegro
-
 Morocco
-
 Mozambique
-
 Myanmar
-
 Namibia
-
 Nepal
-
 Netherlands
-
 New Zealand
-
 Nigeria
-
 North Macedonia
-
 Norway
-
 Oman
-
 Pakistan
-
 Palestine
-
 Panama
-
 Papua New Guinea
-
 Paraguay
-
 Peru
-
 Philippines
-
 Poland
-
 Portugal
-
 Puerto Rico
-
 Qatar
-
 Reunion
-
 Romania
-
 Rwanda
-
 Saudi Arabia
-
 Serbia
-
 Singapore
-
 Slovakia
-
 Slovenia
-
 Somalia
-
 South Africa
-
 Spain
-
 Sri Lanka
-
 Sweden
-
 Switzerland
-
 Syria
-
 Taiwan
-
 Tajikistan
-
 Tanzania
-
 Thailand
-
 Trinidad and Tobago
-
 Tunisia
-
 Turkey
-
 UAE
-
 Uganda
-
 Ukraine
-
 United Kingdom
-
United States
-
 Uruguay
-
 Uzbekistan
-
 Venezuela
-
 Vietnam
-
 Yemen
-
 Zambia
-
 Zimbabwe
- Forex
- Crypto












