

Palantir shares drop about 5.5% after high valuation multiples spark negative reaction despite growth

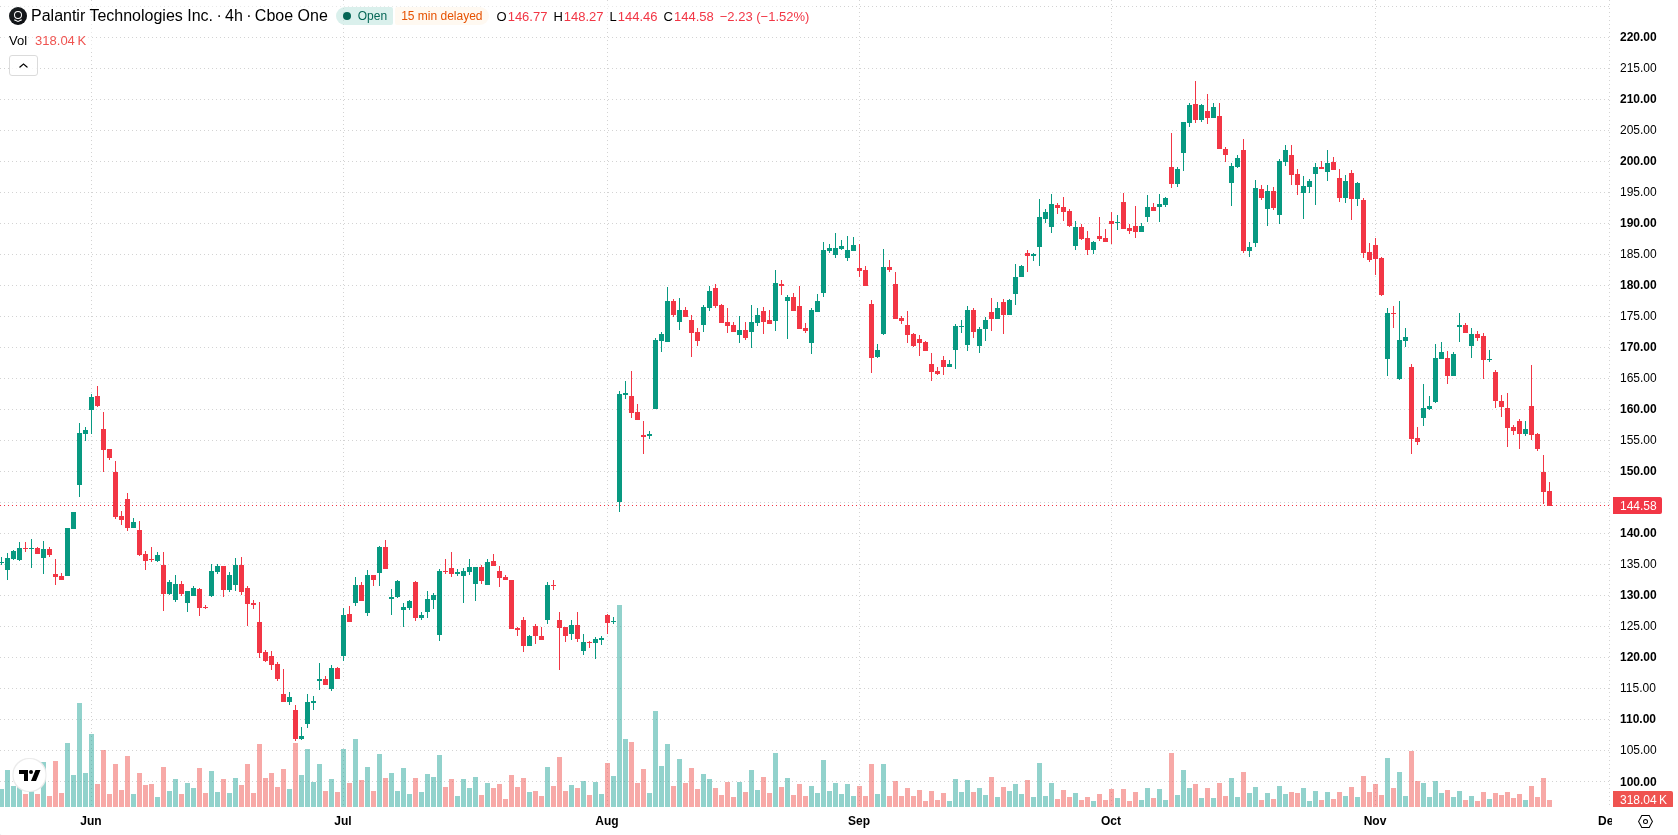
Palantir Technologies Inc (PLTR) fell 5.45% after record quarterly earnings results were accompanied by persistent selling pressure, with high valuation multiples driving a negative market reaction. The decline is supported by the stock remaining below its 20-day, 50-day, and 200-day moving averages, reinforcing broader downside momentum.
 152.48
167.13
Highlights
- Palantir reported record quarterly revenue of $2.31 billion, achieving 96% year-over-year growth and its first quarter above $2 billion.
- U.S. commercial revenue rose 148% to $984 million, surpassing U.S. government revenue for the first time, with upgraded full-year guidance and $10.4 billion in cash.
- Palantir stock trades below key moving averages with negative momentum signals, a projected 5-day range of $135.52 to $152.28 and a very high probability of further downside.
Revenue surge outpaces guidance upgrades but fails to offset valuation drag
Palantir reported record quarterly revenue of $2.31 billion, representing 96% year-over-year growth and its first quarter above $2 billion. U.S. commercial revenue surged by 148% to $984 million, surpassing U.S. government revenue for the first time. The company raised full-year revenue and free cash flow guidance, with a strong cash position of $10.4 billion against total debt of $225.3 million. Market declines have been attributed to high valuation multiples and repricing, even as these results were released, though price action has remained under broader selling pressure.
Downside momentum prevails as key averages breached and sell signals align
Palantir is trading below its 20-day, 50-day, and 200-day moving averages ($174.6, $183.78, and $153.89), signaling downside pressure across all primary timeframes. The nearest support is at $144.72, while resistance is identified at $152.28. The longer-term trend remains bullish as indicated by the overall alignment between the 50-day and 200-day averages. Momentum signals remain negative, with both MACD and Average Directional Index (ADX) indicating sell momentum. The Relative Strength Index (RSI), Stochastic RSI, and Commodity Channel Index (CCI) are all in neutral zones. Bull/Bear Power (BBP) is above zero, reflecting buyers' influence for intraday trades, but the Awesome Oscillator remains negative in line with the established downtrend. Sellers have controlled price action since the start of the session.
Earlier, analysts noted that Palantir faced persistent downside pressure despite strong fundamental performance, with technical weakness and legal risks contributing to a cautious outlook. The latest price action solidifies this narrative and emphasizes the need for traders to closely monitor $144.72 as a pivotal support level potentially defining the upcoming direction.






Latest Palantir News





-
 Afghanistan
-
 Albania
-
 Algeria
-
 Angola
-
 Argentina
-
 Armenia
-
 Australia
-
 Austria
-
 Azerbaijan
-
 Bahamas
-
 Bahrain
-
 Bangladesh
-
 Belarus
-
 Belgium
-
 Bolivia
-
 Botswana
-
 Brazil
-
 Brunei
-
 Bulgaria
-
 Cambodia
-
 Cameroon
-
 Canada
-
 Chile
-
 China
-
 Colombia
-
 Congo
-
 Costa Rica
-
 Cote d'Ivoire
-
 Croatia
-
 Cuba
-
 Cyprus
-
 Czechia
-
 DR Congo
-
 Denmark
-
 Dominican Republic
-
 Ecuador
-
 Egypt
-
 El Salvador
-
 Estonia
-
 Eswatini
-
 Ethiopia
-
 Finland
-
 France
-
 Georgia
-
 Germany
-
 Ghana
-
 Greece
-
 Haiti
-
 Hong Kong
-
 Hungary
-
 India
-
 Indonesia
-
 Iran, Islamic republic
-
 Iraq
-
 Ireland
-
 Israel
-
 Italy
-
 Jamaica
-
 Japan
-
 Jordan
-
 Kazakhstan
-
 Kenya
-
 Korea
-
 Kuwait
-
 Kyrgyzstan
-
 Laos
-
 Latvia
-
 Lebanon
-
 Lesotho
-
 Libya
-
 Lithuania
-
 Luxembourg
-
 Madagascar
-
 Malaysia
-
 Malta
-
 Mauritius
-
 Mexico
-
 Moldova
-
 Mongolia
-
 Montenegro
-
 Morocco
-
 Mozambique
-
 Myanmar
-
 Namibia
-
 Nepal
-
 Netherlands
-
 New Zealand
-
 Nigeria
-
 North Macedonia
-
 Norway
-
 Oman
-
 Pakistan
-
 Palestine
-
 Panama
-
 Papua New Guinea
-
 Paraguay
-
 Peru
-
 Philippines
-
 Poland
-
 Portugal
-
 Puerto Rico
-
 Qatar
-
 Reunion
-
 Romania
-
 Rwanda
-
 Saudi Arabia
-
 Serbia
-
 Singapore
-
 Slovakia
-
 Slovenia
-
 Somalia
-
 South Africa
-
 Spain
-
 Sri Lanka
-
 Sweden
-
 Switzerland
-
 Syria
-
 Taiwan
-
 Tajikistan
-
 Tanzania
-
 Thailand
-
 Trinidad and Tobago
-
 Tunisia
-
 Turkey
-
 UAE
-
 Uganda
-
 Ukraine
-
 United Kingdom
-
United States
-
 Uruguay
-
 Uzbekistan
-
 Venezuela
-
 Vietnam
-
 Yemen
-
 Zambia
-
 Zimbabwe
- Forex
- Crypto












