How To Use The Awesome Oscillator In Binary Options Trading


Editorial Note: While we adhere to strict Editorial Integrity, this post may contain references to products from our partners. Here's an explanation for How We Make Money. None of the data and information on this webpage constitutes investment advice according to our Disclaimer.
The Awesome Oscillator helps binary options traders spot momentum shifts by comparing short- and long-term price trends. Key signals like zero-line crossovers, twin peaks, and saucer patterns make it useful for timing short-expiry trades, but context is critical. It works best in trending markets and during active sessions when volume is high. Traders should use it as a confirmation tool alongside price zones or candlesticks rather than relying on it alone, reducing false signals and improving trade accuracy.
Many traders quickly jump into signals on the Awesome Oscillator, thinking a green or red bar is all they need. But what really matters is catching the shift in pressure just before that color change happens, especially when price is faking a pullback or gearing for a breakout. If you want to trade better with this oscillator in binaries, you have to train your eye on how the bars behave before they flip. That is where those tight expiry setups show up.
Risk warning: Binary options trading is highly risky and may result in a total loss of funds. These speculative instruments often lack strong regulation, with over 80% of traders losing their capital. Invest only what you can afford to lose and seek professional advice.
Introduction to the Awesome Oscillator
The Awesome Oscillator uses a momentum-based tool designed by Bill Williams to measure the strength of price movements. It works by comparing short-term and long-term momentum, giving traders an early view of when a trend may be starting, continuing, or weakening. Learning how to use the Awesome Oscillator in binary options trading helps traders add structure to their setups and avoid entries based only on guesswork.
What is the Awesome Oscillator and how it works
The Awesome Oscillator is displayed as a histogram on the chart. It calculates the difference between a 34-period and a 5-period simple moving average applied to median prices. When bars are above zero, the short-term momentum is stronger than the long-term trend, showing bullish conditions. When bars are below zero, bearish momentum dominates.
Instead of relying on complex signals, the oscillator gives traders a simple way to see shifts in market energy. Green bars suggest momentum is building, while red bars show that it is slowing. This visual clarity is one of the main reasons it is widely used in binary options trading.
Why traders use it for binary options
In short-term setups, timing is critical. The Awesome Oscillator provides quick momentum confirmation that helps traders decide whether to enter a call or put option. Because it reacts to momentum rather than only price, it allows traders to filter out weak entries.
Here is a simple overview of its appeal in binary options:
| Feature | Why it matters in binary options |
|---|---|
| Zero line cross | Confirms whether momentum is bullish or bearish |
| Color-coded histogram | Makes signals easy to read at a glance |
| Works across assets | Useful for forex, stocks, commodities, and indices |
| Short-term focus | Fits well with 5-minute and 15-minute expiry trades |
This combination of speed, clarity, and adaptability makes it one of the go-to momentum tools for short-term traders.
Strengths of this momentum-based indicator
The greatest strength of the Awesome Oscillator is that it often highlights momentum shifts before they appear clearly on price charts. Unlike lagging indicators that confirm only after big moves, it shows whether market energy is building or fading.
It works both in trending and ranging conditions, which makes it versatile. When combined with tools like candlestick confirmation or Fibonacci retracement levels, its signals become stronger. This balance of simplicity and reliability explains why so many traders rely on the Awesome Oscillator binary options approach for consistent short-term trading.
Best binary options strategies using the Awesome Oscillator
The Awesome Oscillator binary options method can be adapted into different strategies depending on market conditions. Traders who study how to use Awesome Oscillator in binary options trading usually focus on three practical setups: momentum continuation with the zero-line cross, reversal detection with twin peaks, and continuation entries through saucer patterns supported by candlestick signals.
Momentum trend-following setup with zero-line cross
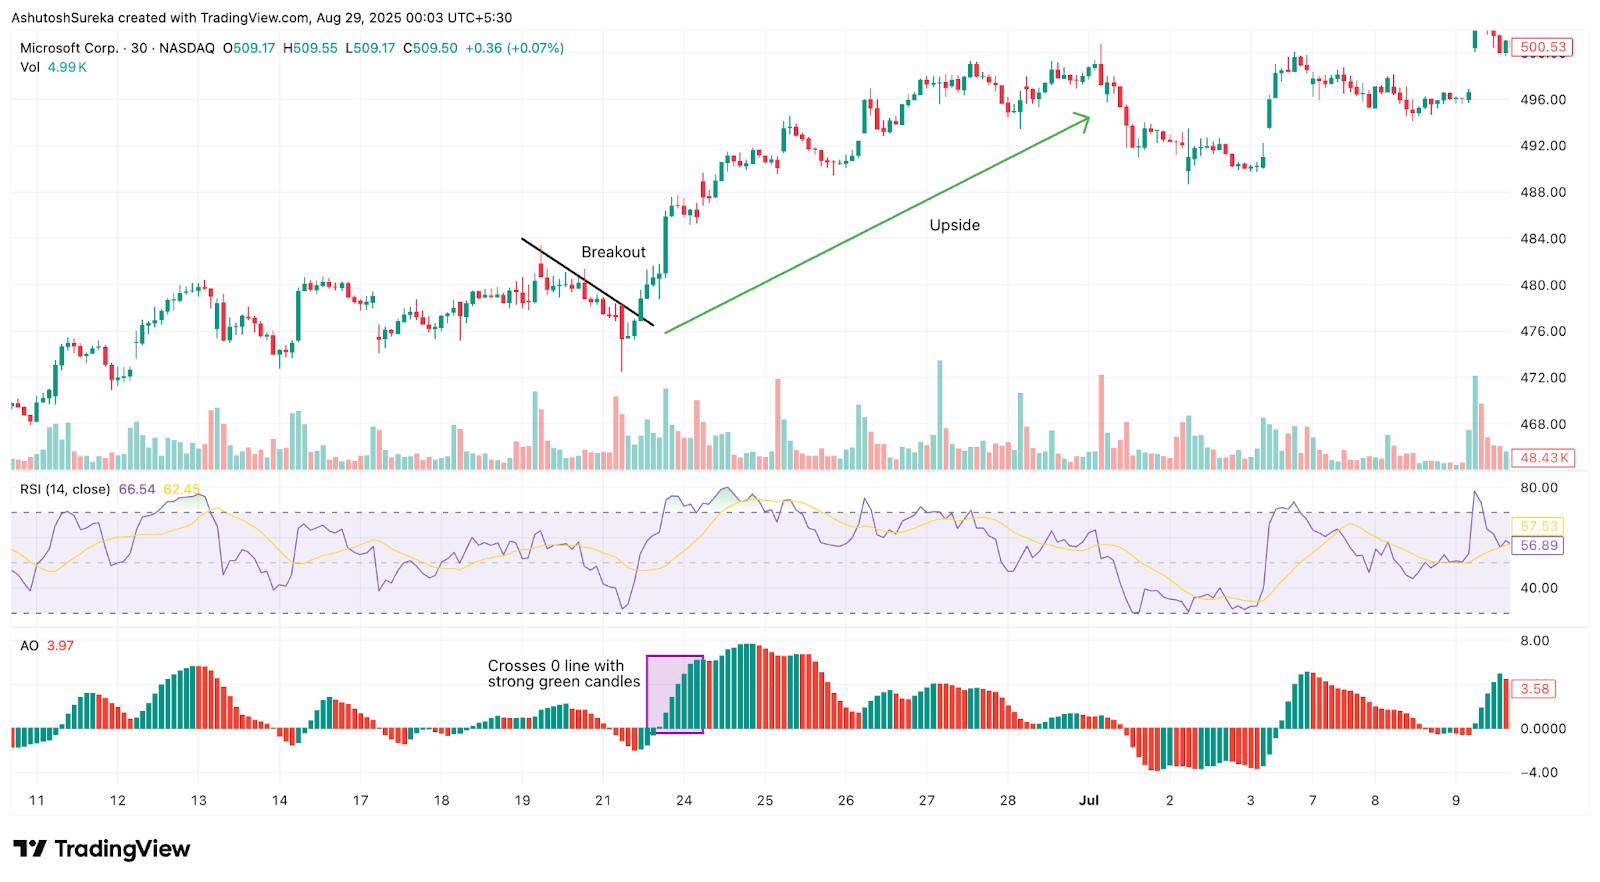
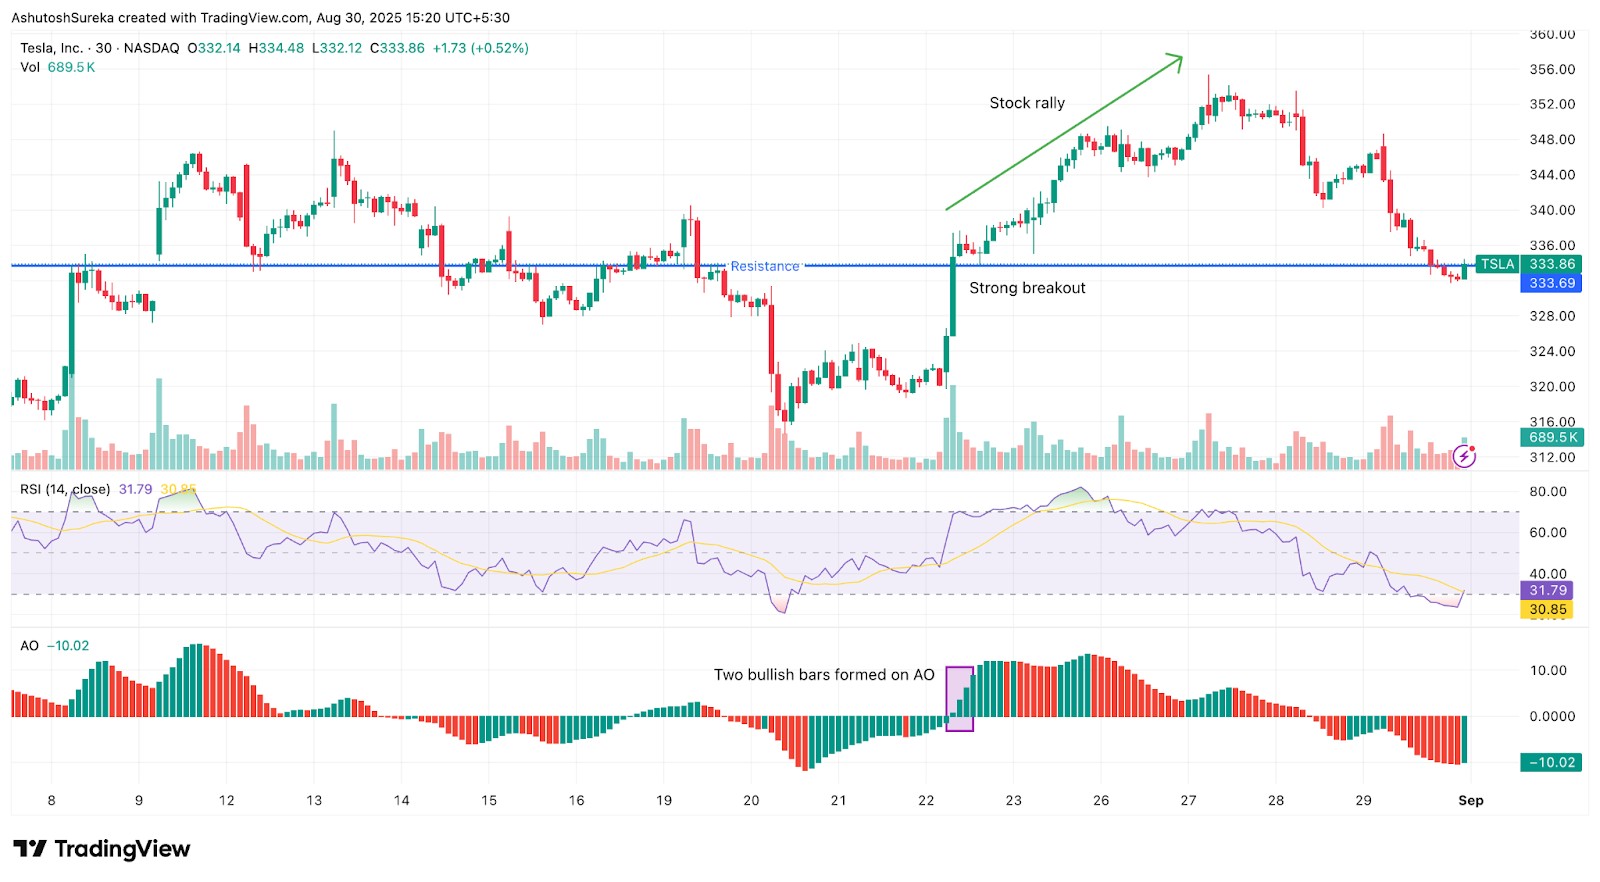
The zero line crossover is the most direct signal from the Awesome Oscillator. When the histogram moves above the zero line, it shows that short-term momentum has overtaken long-term momentum, suggesting bullish conditions. A move below the zero line indicates bearish strength and favors put trades.
This strategy is best used on 5-minute or 15-minute charts, as it reduces noise and avoids false signals. It should not be applied in sideways conditions, where crossovers are frequent but unreliable. For example, if the overall market is moving upward and the oscillator crosses above zero, the confirmation becomes stronger. In sideways conditions, however, the zero line crossover often creates false alerts.
Reversal entry using twin peaks confirmation
The twin peaks setup is more advanced and is often used for spotting reversals in binary options strategies based on the Awesome Oscillator.
It compares two peaks or two troughs that form on the same side of the zero line. The difference between them reveals whether momentum is fading and a reversal is coming.
| Signal type | Formation | Trading implication |
|---|---|---|
| Bullish twin peaks | Two dips below zero, with the second higher than the first | Suggests upward reversal |
| Bearish twin peaks | Two peaks above zero, with the second lower than the first | Suggests downward reversal |
The signal is considered valid once the histogram starts moving back toward the zero line in the direction of the new trend. Traders often pair this with support and resistance to strengthen accuracy. It works best with slightly longer expiries such as 15 minutes or more, since reversals often take more time to develop.
Combining saucer signals with candlestick confirmation
The saucer pattern is a continuation signal that reflects a brief pause in momentum. Unlike the other signals, it does not require a cross of the zero line. On its own, it may give false alerts, but when combined with candlestick confirmation it becomes much more dependable.
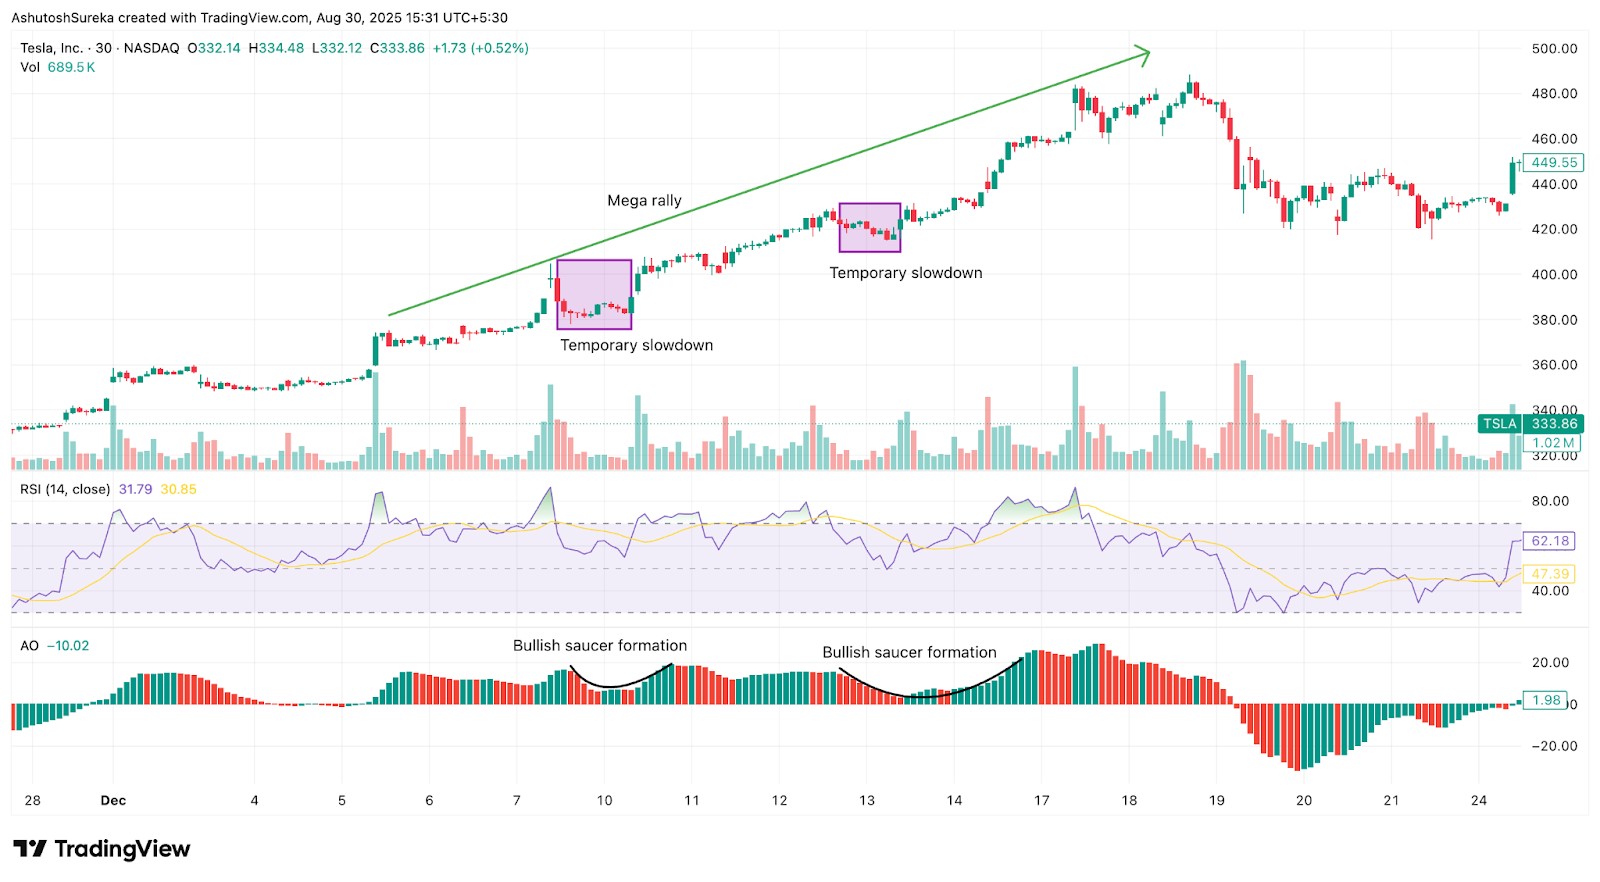
A bullish saucer forms above zero when two red bars are followed by a green bar.
A bearish saucer forms below zero when two green bars are followed by a red bar.
For example, a bullish saucer above zero confirmed by a bullish engulfing candle or pin bar creates a strong case for a call option. A bearish saucer below zero confirmed by a bearish candle setup strengthens the case for a put option. This blend of oscillator signals with candlestick context helps traders filter out weak continuations and focus only on high-quality setups. This pattern is particularly useful for short-term binary options trading, as it shows when momentum is resuming after a temporary slowdown. It is most reliable during strong trends rather than choppy markets.
Limitations and considerations for AO in binaries
Sure, the Awesome Oscillator binary options method is useful, but like any trading tool it has limits. Traders learning to use this indicator must be aware of these drawbacks to avoid relying on it blindly. Knowing when not to use it is just as important as knowing when it works best.
Lagging nature of momentum indicators
The Awesome Oscillator is built on moving averages, which makes it a lagging indicator. It often reacts after momentum has already started building. This means traders may get signals later than they would like, particularly in fast markets. While it confirms strength, it does not always provide the earliest entry point. For very short binary expiry times such as one or two minutes, this lag can reduce accuracy.
Risk of false positives in ranging markets
In sideways markets, the histogram frequently flips above and below the zero line. This creates the impression of momentum shifts that are not actually there. For binary options traders, these false positives can lead to rapid losses.
| Market condition | AO behavior | Result for traders |
|---|---|---|
| Strong trend | Clear histograms and reliable signals | Higher accuracy |
| Ranging phase | Frequent flips and weak signals | Increased false positives |
This shows why context matters: the Awesome Oscillator performs far better in trending conditions than in consolidation.
When not to rely on AO as a standalone tool
Although the Awesome Oscillator highlights momentum well, it should not be used by itself. Traders who treat it as a standalone decision-maker risk entering weak trades. Adding filters such as RSI, volume, or support and resistance makes the signals more reliable.
In short, the oscillator is best seen as a confirmation tool. It shows the strength of the move, but price structure and other filters should guide the final decision. This blended approach ensures the Awesome Oscillator binary options strategy works consistently across different markets.
If you want to put the Awesome Oscillator into action, having the right broker with strong charting and technical tools makes all the difference. Below is a selection of platforms that provide reliable access to advanced indicators and trading software.
| Currency pairs | Crypto | Stocks | Min. deposit, $ | Max. leverage | TradingView | MT5 | cTrader | Regulation | TU overall score | Open an account | |
|---|---|---|---|---|---|---|---|---|---|---|---|
| 120 | Yes | Yes | 1 | 1:30 | Yes | Yes | Yes | CNMV | 5.46 | Study review | |
| 90 | Yes | Yes | No | 1:500 | Yes | Yes | Yes | ASIC, FCA, DFSA, BaFin, CMA, SCB, CySec | 9.25 | Go to broker Your capital is at risk.
|
|
| 90 | Yes | Yes | 1 | 1:500 | Yes | Yes | Yes | ASIC, VFSC, FSA | 9.2 | Go to broker Your capital is at risk. |
|
| 70 | Yes | Yes | 100 | 1:500 | No | Yes | Yes | FCA, CYSEC, FSCA, SCB, FSA (Seychelles) | 8.6 | Go to broker Your capital is at risk. |
|
| 61 | Yes | Yes | 200 | 1:500 | Yes | Yes | Yes | ASIC, CySEC, FSA (Seychelles), The Financial Commission | 8.05 | Go to broker Your capital is at risk. |
When AO signals hit early and catch the crowd off guard

What most people miss with the Awesome Oscillator is how quickly the bar changes not just the color. If it flips green after a slow climb the move has already lost steam. But when it turns sharply with force especially when price touches an important level that is where the trade makes sense. I usually remind beginners not to look at AO alone. Watch how it reacts when price gets close to support or resistance. If it turns fast there you have a setup.
Another thing people often overlook is how AO behaves during different trading hours. At the start of London or New York sessions the AO is more reliable because real volume shows up. If you try reading signals like twin peaks or saucers during dull sessions they often fail. But during high energy periods they give tight expiry chances. Beginners should learn to use AO during peak hours and avoid it when markets are flat. It is not just about patterns, it is about timing.
Conclusion
The Awesome Oscillator works best in binaries when you stop looking at it like a stoplight and start feeling the energy behind it. It is not just about color flips but how fast and where they happen. When you combine AO with active market sessions and important price zones you stop guessing and start trading with control. That one shift can change everything.
FAQs
Does the Awesome Oscillator work better on Forex or crypto?
The Awesome Oscillator works well on both Forex and crypto, but it tends to perform better on assets with clear momentum and trend cycles. It’s especially useful on higher timeframes where signals are more reliable.
What is the difference between Awesome Oscillator and MACD?
The Awesome Oscillator uses simple moving averages based on the median price, while MACD uses exponential moving averages based on closing prices. AO is smoother and faster, but MACD includes a signal line and histogram for more layered analysis.
Is the Awesome Oscillator repainting or fixed after plotting?
The Awesome Oscillator is a fixed, non-repainting indicator. Once a bar is completed, the oscillator value remains unchanged, which makes it dependable for historical backtesting and strategy building.
Should I use AO during major market news?
It’s not recommended to rely solely on AO during major news events, as price action can be highly volatile and unpredictable. News spikes can distort momentum readings and trigger false signals.
Editors' Top Picks and Insights

U.S. Bitcoin reserve: Trump’s unrealized crypto promise

Aiming for leadership: Payment giants prepare a new stablecoin

Proof of Reserves: the new standard for cryptocurrency exchanges

Three trends that could reshape the crypto market over the next decade

Trump financial disclosure: How the president's crypto income became a U.S. ethics issue

Code red: What's behind Bitcoin’s sharp selloff?
Related Articles
Team that worked on the article
Andrey Mastykin is an experienced author, editor, and content strategist who has been with Traders Union since 2020. As an editor, he is meticulous about fact-checking and ensuring the accuracy of all information published on the Traders Union platform.
Dan Blystone began his trading career in 1998 as an arbitrage clerk on the floor of the Chicago Mercantile Exchange (CME). He later traded bond and Eurex futures at proprietary firms such as Altea Trading, gaining valuable experience in high-frequency trading and risk management.
Chinmay Soni is a financial analyst with more than 5 years of experience in working with stocks, Forex, derivatives, and other assets. As a founder of a boutique research firm and an active researcher, he covers various industries and fields, providing insights backed by statistical data.
Index in trading is the measure of the performance of a group of stocks, which can include the assets and securities in it.
Bitcoin is a decentralized digital cryptocurrency that was created in 2009 by an anonymous individual or group using the pseudonym Satoshi Nakamoto. It operates on a technology called blockchain, which is a distributed ledger that records all transactions across a network of computers.
Options trading is a financial derivative strategy that involves the buying and selling of options contracts, which give traders the right (but not the obligation) to buy or sell an underlying asset at a specified price, known as the strike price, before or on a predetermined expiration date. There are two main types of options: call options, which allow the holder to buy the underlying asset, and put options, which allow the holder to sell the underlying asset.
Forex leverage is a tool enabling traders to control larger positions with a relatively small amount of capital, amplifying potential profits and losses based on the chosen leverage ratio.
Cryptocurrency is a type of digital or virtual currency that relies on cryptography for security. Unlike traditional currencies issued by governments (fiat currencies), cryptocurrencies operate on decentralized networks, typically based on blockchain technology.

-
 Afghanistan
-
 Albania
-
 Algeria
-
 Angola
-
 Argentina
-
 Armenia
-
 Australia
-
 Austria
-
 Azerbaijan
-
 Bahamas
-
 Bahrain
-
 Bangladesh
-
 Belarus
-
 Belgium
-
 Bolivia
-
 Botswana
-
 Brazil
-
 Brunei
-
 Bulgaria
-
 Cambodia
-
 Cameroon
-
 Canada
-
 Chile
Chile
-
 China
China
-
 Colombia
-
 Congo
Congo
-
 Costa Rica
-
 Cote d'Ivoire
-
 Croatia
-
 Cuba
Cuba
-
 Cyprus
-
 Czechia
-
 DR Congo
-
 Denmark
-
 Dominican Republic
-
 Ecuador
-
 Egypt
Egypt
-
 El Salvador
-
 Estonia
-
 Eswatini
-
 Ethiopia
-
 Finland
-
 France
-
 Georgia
-
 Germany
-
 Ghana
Ghana
-
 Greece
-
 Haiti
Haiti
-
 Hong Kong
-
 Hungary
-
 India
India
-
 Indonesia
-
 Iran, Islamic republic
-
 Iraq
Iraq
-
 Ireland
-
 Israel
-
 Italy
Italy
-
 Jamaica
-
 Japan
Japan
-
 Jordan
-
 Kazakhstan
-
 Kenya
Kenya
-
 Korea
Korea
-
 Kuwait
-
 Kyrgyzstan
-
 Laos
Laos
-
 Latvia
-
 Lebanon
-
 Lesotho
-
 Libya
Libya
-
 Lithuania
-
 Luxembourg
-
 Madagascar
-
 Malaysia
-
 Malta
Malta
-
 Mauritius
-
 Mexico
-
 Moldova
-
 Mongolia
-
 Montenegro
-
 Morocco
-
 Mozambique
-
 Myanmar
-
 Namibia
-
 Nepal
Nepal
-
 Netherlands
-
 New Zealand
-
 Nigeria
-
 North Macedonia
-
 Norway
-
 Oman
Oman
-
 Pakistan
-
 Palestine
-
 Panama
-
 Papua New Guinea
-
 Paraguay
-
 Peru
Peru
-
 Philippines
-
 Poland
-
 Portugal
-
 Puerto Rico
-
 Qatar
Qatar
-
 Reunion
-
 Romania
-
 Rwanda
-
 Saudi Arabia
-
 Serbia
-
 Singapore
-
 Slovakia
-
 Slovenia
-
 Somalia
-
 South Africa
-
 Spain
Spain
-
 Sri Lanka
-
 Sweden
-
 Switzerland
-
 Syria
Syria
-
 Taiwan
-
 Tajikistan
-
 Tanzania
-
 Thailand
-
 Trinidad and Tobago
-
 Tunisia
-
 Turkey
-
 UAE
UAE
-
 Uganda
-
 Ukraine
-
 United Kingdom
-
United States
-
 Uruguay
-
 Uzbekistan
-
 Venezuela
-
 Vietnam
-
 Yemen
Yemen
-
 Zambia
-
 Zimbabwe
- Forex
- Crypto
