Is America Going Into A Recession? Trump, Economic Signals & What Traders Should Know


Editorial Note: While we adhere to strict Editorial Integrity, this post may contain references to products from our partners. Here's an explanation for How We Make Money. None of the data and information on this webpage constitutes investment advice according to our Disclaimer.
The U.S. isn’t in a formal recession yet, but GDP softness, uneven job growth, weak consumer sentiment, and credit market stress show rising fragility. Trump-era policy shifts could add volatility and inflation risk, so traders should stay defensive, manage exposure, and be ready for sector-specific downturns.
Amid global jitters, stubborn inflation, and tighter credit, traders are left asking whether this is a fleeting economic wobble or something more serious. Here’s a grounded look at what’s really going on, no hype, looking at both long-standing issues and immediate warning signs, and what it means if Trump-era policies shake things further.
Defining a recession: More than just two quarters of decline
Understanding whether America is going into a recession or are we officially in a recession takes more than glancing at GDP data. The old rule of “two consecutive negative GDP quarters” is far too simplistic in today’s interconnected economy. The NBER now considers a range of metrics beyond GDP, which means a country can experience an economic downturn even without meeting that narrow rule.
Recessions today are assessed using trends in employment, consumer spending, industrial production, and real income. A sudden rise in jobless claims, falling factory output, and weak retail sales may signal an economic contraction long before GDP data confirms it.
By the time GDP reports confirm a recession, markets have often priced in the downturn. Investors, businesses, and even job seekers benefit from monitoring leading indicators, such as manufacturing surveys or credit conditions, to anticipate shifts earlier.
Global supply chain disruptions, sudden policy shifts, or credit market stress can accelerate an economic downturn even when domestic consumption remains steady. Beginners who track these “trigger events” often get a faster read on whether an economic contraction is forming.
Is the U.S. economy officially in a recession?
While the U.S. isn’t in a textbook recession yet, certain metrics are flashing early-warning signs that smart investors and beginners alike should watch closely.
GDP slowdown is sector-specific
U.S. GDP grew at just 1.4% in Q1 2025, signaling a slowdown rather than a full contraction. This is more of a “rolling recession,” where pockets like tech and real estate face declines, while other areas still show resilience.
Labor market resilience is uneven
Unemployment has inched up to 4.2%, but job creation remains positive. The catch? New positions are often in lower-paying sectors, meaning wage growth is slowing compared to high-skill industries.
Consumer pullback could spread
Consumer spending fell in May–June for the first time in 18 months. This drop isn’t just seasonal, it’s tied to higher debt loads, cooling sentiment, and concerns about the inflation outlook.
Monetary policy pressure is mounting
With prices still above target, the Federal Reserve may proceed with further interest rate hikes. These could cool inflation but also risk tipping already fragile sectors into contraction.
The “Trump Recession”: political hype or economic signal?
Even for beginners, the key to understanding whether the so-called “Trump Recession” is hype or reality is to connect political motives with hard market data.
The phrase was coined by Democratic strategists to connect an economic slowdown forecast with Trump-era tax cuts and deregulation. This framing was meant to position market risks as a political liability, even before macroeconomic indicators had fully shifted.
Between 2017 and 2019, Trump’s policies increased corporate profits and pushed equity markets to record highs. However, his pandemic-era fiscal expansions and prolonged low-rate environment contributed to debt growth that could make the economy more vulnerable when Federal Reserve recession signals intensify.
A subtle but powerful indicator is the movement of treasury yields. Inversions during Trump’s presidency were early warnings for structural stress, not just cyclical dips. Beginners often overlook how these inversions reflect traders’ belief that short-term rates are misaligned with long-term growth potential.
Current proposals double down on deregulation and apply pressure on the Fed for looser monetary policy. While this can create short-term equity surges, it risks reigniting inflationary pressures — an outcome that would reinforce economic slowdown forecast models.
Traders’ concern
For market participants, the real debate is not the political label but the divergence between public perception and core economic fundamentals. In times of uncertainty, aligning portfolio positioning with both data and sentiment becomes crucial, especially when treasury yields begin pricing in higher recession risk before headlines catch on.
Key economic indicators to watch in 2025
1. Yield curve inversion
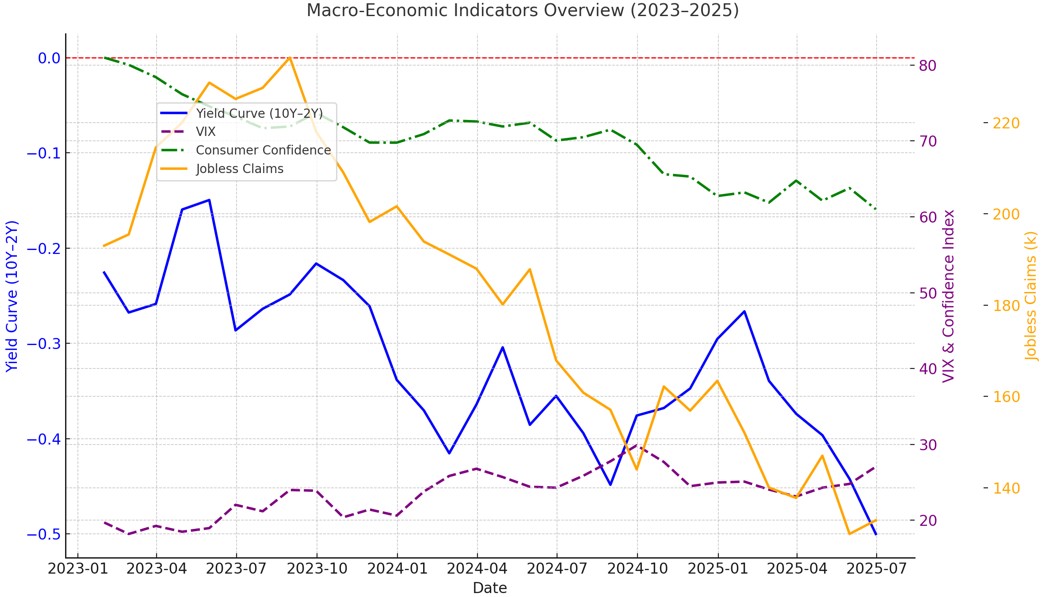
The spread between the 10-year and 2-year Treasury yields has remained inverted since May 2023, marking over 14 consecutive months of inversion. Typically, this kind of inversion signals a downturn in the economy within 12 to 24 months. At present, the average gap sits around -0.25%.
However, this time the usual script seems off. Factors like persistent inflation, a contracting Fed balance sheet, and leftover liquidity in the system are disrupting how the business cycle traditionally plays out.
2. Corporate earnings slowdown
Forecasts for S&P 500 earnings in Q2 2025 suggest year-on-year growth of only 1.8%. While tech stocks are recovering thanks to the continued impact of AI advancements, sectors like consumer goods and industrials continue to post disappointing results. The broader market is treading cautiously, and the risk of a market correction looms as investor sentiment adjusts to slower growth and missed expectations.
3. Consumer confidence & spending
In June 2025, the University of Michigan Sentiment Index dropped to 64.2, highlighting growing consumer pessimism. Durable goods orders declined by 2.3% year-on-year, and personal savings rates are still hovering below 4%. There's growing evidence of spending fatigue, especially within middle-income groups, which is amplifying stagflation fears as inflation persists while demand slows.
4. Real estate & Credit markets
Mortgage applications fell by 19% compared to the previous year, according to data from the Mortgage Bankers Association. Stress in commercial real estate continues to build, with rising refinancing costs and elevated office vacancy rates weighing down REITs. Meanwhile, auto loan delinquencies surged by 23% year-on-year, signaling potential cracks in credit quality. These developments come on the heels of a downward GDP revision, which only adds to concerns about the economy’s near-term trajectory.
What traders should do: Recession playbook
With macro uncertainty high, traders need a disciplined, multi-layered approach focused on capital preservation, adaptive positioning, and volatility-aware strategies. The aim isn’t just to avoid losses, it’s about finding selective opportunities in sectors that typically hold up well during late-cycle slowdowns or periods of economic contraction. A thoughtful approach can help traders stay flexible as the market shifts.
Defensive allocations
Historically, when markets face a downturn, sectors like consumer staples, utilities, and healthcare tend to perform better than the broader market. These industries usually maintain steady demand regardless of where we are in the cycle and often have strong balance sheets and consistent dividends. During past interest rate hikes, ETFs like XLP (Consumer Staples) and XLV (Healthcare) have shown positive returns, gaining around 6–9%.
Gold (GLD) and TIPS (Treasury Inflation-Protected Securities) also serve as solid hedges against dollar volatility and shifting inflation outlook. Another strategy is to focus on high-quality dividend-paying stocks with strong free cash flow. Companies like Johnson & Johnson, Procter & Gamble, or utility providers such as Duke Energy can offer a sense of stability during earnings pressure or a potential economic downturn.
Tactical volatility plays
Volatility shouldn’t be seen only as a risk, it can also be used as an opportunity. The VIX index held above 22 through July 2025, indicating persistent demand for downside protection and uncertainty in the market. Traders can take advantage of this by setting up straddles or strangles ahead of high-impact events:
Monthly CPI reports.
Non-Farm Payroll (NFP) data (typically released on the first Friday).
FOMC meetings (next: Sept 17–18, 2025).
These events often trigger spikes in implied volatility, presenting chances for high-delta, short-term trades. In periods when jobless claims surprise to the upside, these spikes can be even more pronounced, making timely volatility positioning a powerful tool.
Strategic hedges
Should the Fed begin shifting toward a more dovish tone, short-duration Treasuries like the 2Y note could lose value as the curve steepens. In that case, a futures or swap trade using a 10Y/2Y steepener might capture the shift. Meanwhile, a strengthening U.S. dollar, especially against currencies like the yen or euro, could act as a safe haven if geopolitical tensions rise or election-related uncertainty builds.
Pay close attention to emerging markets as well. ETFs or FX pairs like USD/MXN and USD/BRL have shown increased implied volatilities, jumping 15–20% recently. These assets can be especially sensitive to changing sentiment around Fed policy and broader Federal Reserve recession narratives in the media.
Additional notes
Avoid overexposure to speculative tech, unprofitable growth, or small caps, unless hedged with sector puts or index spreads.
Political instability is likely to drive risk premiums higher across sectors such as healthcare, clean energy, and defense, depending on policy expectations.
Use tools like realized vs. implied volatility ratios, Skew index, and equity/bond correlation shifts to rebalance dynamically.
Contrarian perspective: Why the U.S. might avoid a full-blown recession
Even with all the recession chatter, there are strong shifts happening that could help the U.S. avoid a full-blown recession.
AI is giving the U.S. a serious productivity lift. In industries using it heavily, output per worker jumped about 30% from 2019 to 2024, or roughly 5% each year. Goldman Sachs estimates AI could boost productivity growth by 0.3 to 3.0 percentage points annually, with a median of 1.5, and some workers are reporting gains of up to 80%.
Manufacturing is regaining its footing. The CHIPS Act is putting $52.7 billion into U.S. semiconductor production, and Micron’s expansion alone is expected to add around 90,000 jobs. By anchoring more supply onshore, the U.S. is reducing its vulnerability to offshore shocks.
Supply chain pressures are easing. Truckload spot rates rose 6.5% year-over-year in Q2, down from 11.6% in Q4. Ocean freight capacity is now outpacing demand, which is helping bring down the $2.6 trillion in logistics costs that still make up about 9% of GDP.
A soft landing from the Fed is still on the table. If rate hikes remain modest and the labor market stays steady, the U.S. could maintain moderate growth instead of sliding into a full recession.
The IMF now expects U.S. GDP to grow between 1.8% and 1.9% in 2025, down from earlier projections of 2.7%. Easing trade tensions and fresh investment incentives are helping to keep the economy more resilient than some forecasts suggest.
Wall Street’s silence may quietly fuel a 2025 stagflation spiral

As inflationary pressure creeps back into everyday life in 2025, the real warning signal isn’t headline CPI, it’s the divergence between corporate credit issuance and productivity growth. Most beginners miss this. When private firms start loading up on short-term debt while investing less in innovation or expansion, it’s not just a liquidity crunch brewing, it’s the early sign of stagflation. Trump’s fiscal rhetoric may boost market sentiment, but beneath the surface, businesses are entering a leverage trap, betting on demand that may never come. That dislocation between capital deployment and real output can quietly cause long-term economic drag.
Here’s where it gets even more concerning: if the Fed hesitates to tighten in time, fearing political backlash or overcorrection, it could freeze the yield curve in a way that suffocates mid-sized lenders and accelerates shadow banking activity. Watch syndicated loan activity and default swaps on regional banks instead of obsessing over S&P levels. They’ll give you a far clearer pulse on incoming distress. For a beginner, tracking the quality of credit (not just quantity) offers a better lens into a stealth recession than any mainstream index.
Conclusion
While the U.S. is not officially in a recession, multiple indicators, including weak consumer sentiment, rising jobless claims, and an inverted yield curve, suggest increased fragility. The 2024 election and potential Trump policy shifts may accelerate market volatility and inflation risks. Traders should remain vigilant, diversify into defensive sectors, and use volatility as a tactical advantage. A flexible, risk-aware approach will be critical as macro conditions evolve through 2025. Markets won't wait, strategy must lead.
FAQs
How do inverted yield curves affect stock portfolios?
An inverted yield curve often signals a future recession. Investors typically reduce risk by shifting to defensive sectors and dividend stocks.
What’s the impact of rising auto loan delinquencies?
Higher delinquencies may indicate household financial stress, which can hurt consumer credit firms and signal broader economic weakness.
Can political shifts like a Trump win affect Fed policy?
Yes. Proposed pressure on the Fed could lead to faster rate cuts, which may stimulate markets but risk inflation resurgence or stagflation.
How should traders adjust for rolling recessions across sectors?
Rotating exposure to sectors like energy, defense, and staples while reducing overweights in tech and real estate helps hedge concentrated risk.
Editors' Top Picks and Insights

Brent nears $100: Why oil prices are rising

Gram Wallet launch: Can Telegram bring crypto to the masses?

AI without limits: How dangerous are neural networks?

Worldcoin on Wall Street: From iris scans to ETF

Mark Cuban's wealth philosophy: Why stocks matter more than salary or crypto

Dangerous but indispensable: Why the crypto market needs bridges
Related Articles
Team that worked on the article
Anastasiia has 17 years of experience in finance and content marketing. She believes that the support of information and expert opinion is very important for the success of investors and new traders.
One of the most widely respected and quoted currency experts, Marc Chandler has been analyzing and advising on the global capital markets for more than 30 years. Throughout his career on Wall Street, Chandler has advised private businesses, hedge funds and asset managers on navigating the foreign exchange market.
Chinmay Soni is a financial analyst with more than 5 years of experience in working with stocks, Forex, derivatives, and other assets. As a founder of a boutique research firm and an active researcher, he covers various industries and fields, providing insights backed by statistical data.
CFD is a contract between an investor/trader and seller that demonstrates that the trader will need to pay the price difference between the current value of the asset and its value at the time of contract to the seller.
Yield refers to the earnings or income derived from an investment. It mirrors the returns generated by owning assets such as stocks, bonds, or other financial instruments.
Economic indicators — a tool of fundamental analysis that allows to assess the state of an economic entity or the economy as a whole, as well as to make a forecast. These include: GDP, discount rates, inflation data, unemployment statistics, industrial production data, consumer price indices, etc.
Bitcoin is a decentralized digital cryptocurrency that was created in 2009 by an anonymous individual or group using the pseudonym Satoshi Nakamoto. It operates on a technology called blockchain, which is a distributed ledger that records all transactions across a network of computers.
An investor is an individual, who invests money in an asset with the expectation that its value would appreciate in the future. The asset can be anything, including a bond, debenture, mutual fund, equity, gold, silver, exchange-traded funds (ETFs), and real-estate property.

-
 Afghanistan
-
 Albania
-
 Algeria
-
 Angola
-
 Argentina
-
 Armenia
-
 Australia
-
 Austria
-
 Azerbaijan
-
 Bahamas
-
 Bahrain
-
 Bangladesh
-
 Belarus
-
 Belgium
-
 Bolivia
-
 Botswana
-
 Brazil
-
 Brunei
-
 Bulgaria
-
 Cambodia
-
 Cameroon
-
 Canada
-
 Chile
Chile
-
 China
China
-
 Colombia
-
 Congo
Congo
-
 Costa Rica
-
 Cote d'Ivoire
-
 Croatia
-
 Cuba
Cuba
-
 Cyprus
-
 Czechia
-
 DR Congo
-
 Denmark
-
 Dominican Republic
-
 Ecuador
-
 Egypt
Egypt
-
 El Salvador
-
 Estonia
-
 Eswatini
-
 Ethiopia
-
 Finland
-
 France
-
 Georgia
-
 Germany
-
 Ghana
Ghana
-
 Greece
-
 Haiti
Haiti
-
 Hong Kong
-
 Hungary
-
 India
India
-
 Indonesia
-
 Iran, Islamic republic
-
 Iraq
Iraq
-
 Ireland
-
 Israel
-
 Italy
Italy
-
 Jamaica
-
 Japan
Japan
-
 Jordan
-
 Kazakhstan
-
 Kenya
Kenya
-
 Korea
Korea
-
 Kuwait
-
 Kyrgyzstan
-
 Laos
Laos
-
 Latvia
-
 Lebanon
-
 Lesotho
-
 Libya
Libya
-
 Lithuania
-
 Luxembourg
-
 Madagascar
-
 Malaysia
-
 Malta
Malta
-
 Mauritius
-
 Mexico
-
 Moldova
-
 Mongolia
-
 Montenegro
-
 Morocco
-
 Mozambique
-
 Myanmar
-
 Namibia
-
 Nepal
Nepal
-
 Netherlands
-
 New Zealand
-
 Nigeria
-
 North Macedonia
-
 Norway
-
 Oman
Oman
-
 Pakistan
-
 Palestine
-
 Panama
-
 Papua New Guinea
-
 Paraguay
-
 Peru
Peru
-
 Philippines
-
 Poland
-
 Portugal
-
 Puerto Rico
-
 Qatar
Qatar
-
 Reunion
-
 Romania
-
 Rwanda
-
 Saudi Arabia
-
 Serbia
-
 Singapore
-
 Slovakia
-
 Slovenia
-
 Somalia
-
 South Africa
-
 Spain
Spain
-
 Sri Lanka
-
 Sweden
-
 Switzerland
-
 Syria
Syria
-
 Taiwan
-
 Tajikistan
-
 Tanzania
-
 Thailand
-
 Trinidad and Tobago
-
 Tunisia
-
 Turkey
-
 UAE
UAE
-
 Uganda
-
 Ukraine
-
 United Kingdom
-
United States
-
 Uruguay
-
 Uzbekistan
-
 Venezuela
-
 Vietnam
-
 Yemen
Yemen
-
 Zambia
-
 Zimbabwe
- Forex
- Crypto
