What Happens In A Recession


Editorial Note: While we adhere to strict Editorial Integrity, this post may contain references to products from our partners. Here's an explanation for How We Make Money. None of the data and information on this webpage constitutes investment advice according to our Disclaimer.
In a recession, traders face falling stock prices (S&P 500 typically drops 20–40%), spiking volatility (VIX often above 80), and shifting capital flows. Safe-haven currencies (USD, JPY), gold, and defensive sectors outperform, while high-beta assets and EM currencies fall. Smart traders adapt with risk controls, trend setups, and volatility strategies.
Since World War II, the United States has gone through 12 recessions. Each one triggered a domino effect across jobs, prices, businesses, and markets. For traders, these aren’t just headlines. They are turning points.
At its core, a recession is a significant decline in economic activity, typically lasting more than a few months, marked by falling GDP, rising unemployment, and weakening consumer confidence. But to traders, it means something more. It signals heightened volatility, emotional markets, shifting correlations, and the chance to profit or suffer depending on your timing and strategy.
This article breaks down what really happens during a recession, not just in the economy but in the trading world. We will connect historical data with real market behavior and show you how traders reposition during economic downturns. Whether you are in stocks, Forex, or crypto, this is your recession playbook rooted in numbers, not noise.
What is a recession?
When trying to understand what happens in a recession, it’s crucial to look beyond headlines or a dip in the stock market. A true recession reflects a broader economic contraction – declining consumer demand, job losses, tightening credit, and shrinking industrial output. According to the NBER, it’s defined by a significant downturn in economic activity spread across the economy and lasting more than a few months. Traders who grasp these underlying shifts – not just the surface-level symptoms – can adapt faster and make smarter decisions.
According to NBER, a recession isn’t just about two quarters of negative GDP growth. It’s defined as a significant decline in economic activity spread across the economy, lasting more than a few months, and visible in real GDP, employment, industrial production, and wholesale-retail sales. This broader view captures recessions that don’t meet the “two quarters” rule but still hit households and businesses hard.
While the triggers for a recession are many, each helps us understand how to survive a recession, because each type requires a different response from governments and investors. Discover smart strategies and recession proof investments to protect your wealth and grow returns even in uncertain economic times.
Key statistical context
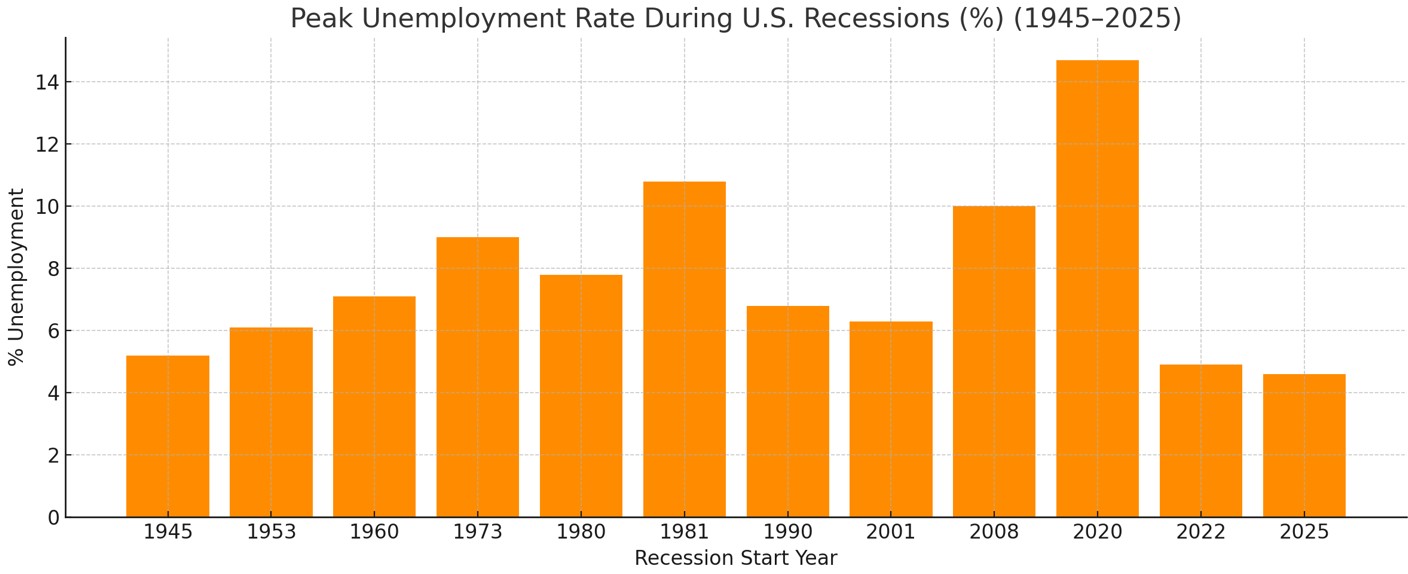
Since 1945, the U.S. has experienced 12 recessions, each lasting an average of 11.1 months, with GDP contracting between 0.3% and 5.1%.
The 2008 Great Recession saw a peak unemployment rate of 10.0%, a GDP decline of 5.1%, and a 57% drop in the S&P 500 from peak to trough.
During the 2020 COVID-19 recession, GDP contracted 31.4% (annualized, Q2) and unemployment spiked to 14.7%.

Defining differences
A recession. Typically lasts 6–18 months, marked by GDP shrinkage over two consecutive quarters.
A depression. Much rarer and deeper. The Great Depression (1929–1939) led to 25% unemployment and a 29% drop in GDP. Understanding the difference between recession and depression isn’t theoretical, it determines how you survive and where you profit.
A market correction. A 10%+ decline in stock prices, often within days or weeks, without broader economic contraction.

Common triggers
Inflation control through aggressive rate hikes (e.g., Fed’s 4.75% hike cycle in 2022–2023).
Demand shocks. The COVID-19 outbreak (2020) and 9/11 attacks (2001) caused immediate economic halts.
Global contagion. In 2008, U.S. subprime mortgage failures triggered a global credit freeze.
Many recessions are preceded by a yield curve inversion, most recently in mid-2022, when the U.S. 2-year Treasury yield surpassed the 10-year. Historically, this signal has preceded every U.S. recession since 1955, with a lead time of 6 to 24 months.
Hook: Since WWII, the U.S. has experienced 12 recessions, each triggering a revaluation of every major asset class.
Macroeconomic effects of a recession
Recessions don’t just shrink GDP, they affect everything from jobs to spending in ways most beginners don’t see coming.
Yield curve inversion signals panic before it happens. When short-term bonds pay more than long ones, it usually means people expect rate cuts and recession worries before any official news.
Credit dries up in strange places. During an economic downturn, banks pull back loans even for good companies, not just the risky ones.
Consumer habits flip fast. People don’t just spend less, they start switching to cheaper brands, cutting subscriptions, and putting off big buys, which squeezes profits for brands that aren’t the cheapest or the biggest.
Layoffs hit support sectors first. Rising unemployment often starts with roles that don’t make money directly, like HR and admin, before hitting factory or field jobs.
Bear markets follow silent signals. A bear market isn’t always obvious. Watch for insider selling, smaller dividends, and companies quietly lowering profit expectations, they’re early red flags most people ignore.
Recessions expose zombie companies. Some businesses only survive on cheap loans and go under once that option disappears, causing bankruptcies to spike among smaller stocks.
Government stimulus always comes, but timing is messy. Policymakers respond with rate cuts and stimulus, but it doesn’t always come on time. By the time help arrives, the market crash may have already taken out a lot of fragile investments.
Central banks move currencies, not just stocks. Traders who track central bank speeches and rate decisions often make smart trades before others catch on. Pairs like USD/JPY often react quicker than the stock market.
How the financial markets react in a recession
Recessions hit financial markets hard, but not all assets behave the same. The stock market typically sees 20 to 30 percent drawdowns, with the S&P 500 falling 38.5 percent in 2008 and 34 percent in early 2020. Defensive sectors like consumer staples, healthcare, and utilities tend to outperform. Volatility spikes, with the VIX reaching 80-plus levels, offering tactical setups for options and short-term trades.
In Forex, safe-haven currencies like USD, JPY, and CHF strengthen, while EM currencies weaken due to capital flight and rate shocks. For example, USD/JPY dropped from 110 to 90 in 2008, and similar behavior repeated in 2020.
Commodities reflect falling demand. Oil crashes, dropping from $145 to $35 in 2008, and gold, though seen as a hedge, often lags before rising. It gained 5.8 percent in 2008 and 25.1 percent in 2020.
Crypto is still maturing. Despite its anti-bank narrative, Bitcoin lost over 50 percent during the COVID crash before rebounding with liquidity flows.
Key insight: Understanding how each market reacts allows traders to rotate capital, manage risk, and seize high-probability setups as recession unfolds.
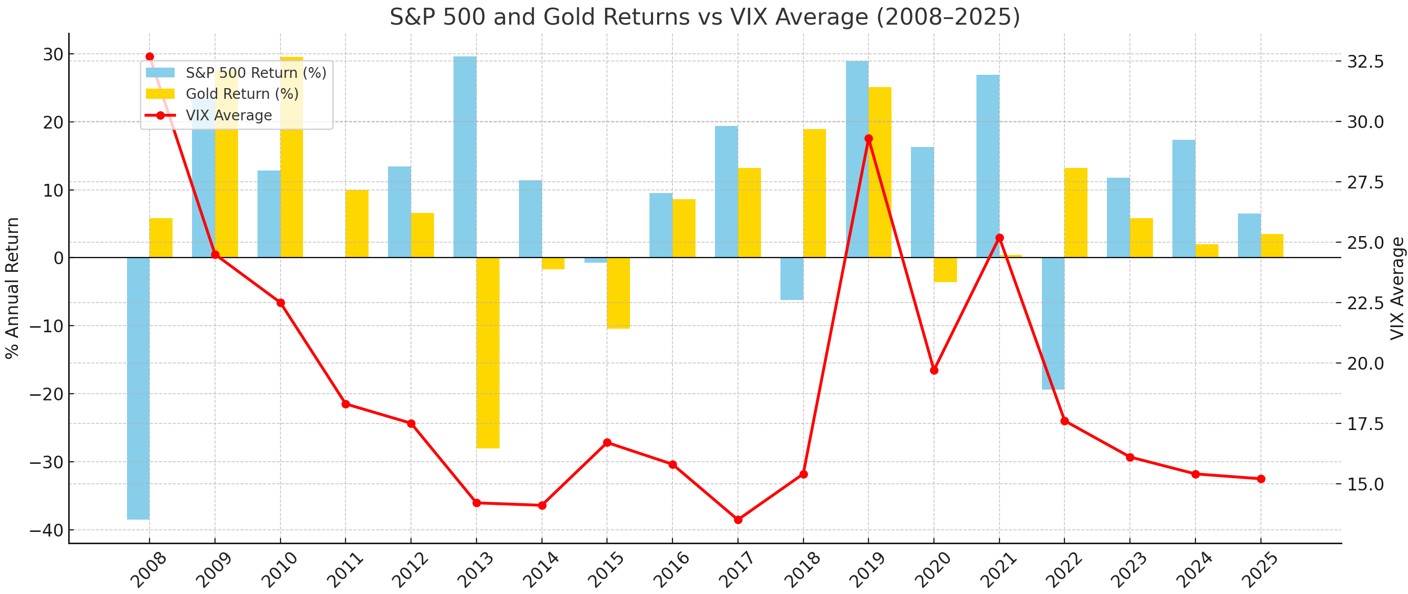
As visualized above, gold and the VIX tend to outperform equities during recessions, making them vital components of any recession-proof strategy.
What happens during a recession?
Recessions reshape trading behavior across the board. Retail participation usually spikes as volatility draws in day traders chasing quick gains. Platforms like Robinhood saw millions of new users in 2020 alone. But this often leads to emotional trades, misjudged rebounds, and high-risk exposure.
Institutional strategies, by contrast, turn defensive. Fund managers shift into cash, treasuries, and recession-proof sectors like healthcare and utilities. Options hedging, gold, and volatility products see more weight.
Brokers tighten risk controls. Margin requirements rise, short-selling costs spike, and leverage on Forex and indices is reduced. Traders need more capital to stay in the game.
High-frequency and algorithmic traders thrive. Fast-changing volatility creates profitable micro-movements, arbitrage windows, and breakdowns in normal correlations.
Our insight: Those who understand correlation shifts, like USD decoupling from risk assets, gain a real edge when the rest of the market reacts late.
What to do during a recession as a trader
During a recession, market conditions become highly unpredictable, with increased volatility, shifting trends, and sudden macroeconomic shocks. For traders, this environment presents both risks and opportunities. Staying reactive and adaptive is crucial – traditional strategies may no longer be effective, and risk management takes center stage. Below is a practical guide outlining key tactics traders can use during a recession to navigate turbulent markets with greater confidence and control:
| Tactic | Purpose |
|---|---|
| Cut position sizes | Reduce exposure during wild swings |
| Diversify asset exposure | Trade FX, commodities, indices |
| Use trailing stops | Lock in gains during fast moves |
| Monitor macro releases | React to CPI, jobs, Fed minutes |
| Stay liquid | Avoid low-float, illiquid names |
| Focus on volatility tools | Trade VIX, UVXY, SPX options |
| Paper trade new strategies | Test ideas without risking capital |
Ultimately, what to do during a recession as a trader is less about making big bets, and more about surviving with precision, patience, and preparation.
Historical case studies
In 2008, the S&P 500 fell 38.5%, VIX hit 80.9, and oil crashed. Shorting banks, going long volatility, and using inverse ETFs proved highly effective. The 2020 COVID crash was sharper but faster; S&P dropped 34% in 33 days, VIX hit 82.7, and tech and crypto led the rebound. Quick pivots from fear to risk-on paid off.
In 2018–2019, trade wars caused a 19.8% drop. Gold rose, yield curves inverted, and FX pairs like CNH and AUD became volatile. Algorithms thrived.
In 2022, the Ukraine war and rate hikes spiked oil and USD. Commodity trades and EM FX shorts worked best.
The 2024–2025 tariff-driven slowdown (ongoing) shows a 16% market dip, with gold up 7%. Traders rotated into energy and USD, avoiding exporters.
Key lesson: In every recession, volatility is your signal, not your enemy. The faster you adapt to macro triggers, the more edge you gain.
| Event | S&P 500 decline | Gold return | VIX peak | Unemployment peak | GDP decline |
|---|---|---|---|---|---|
| 2001 Dot-com bust | −49% | +1.9% | 44 | 6.3% | −0.3% |
| 2008 Financial crisis | −38.5% | +5% | 80.9 | 10.0% | −5.1% |
| 2020 COVID-19 recession | −34% | +25.1% | 82.7 | 14.7% | −31.4% |
| 2024–2025 Trump tariff war (est.) | −16.2% | +7.4% | ~39.5 | ~5.2% | −1.2% |

Trader strategies for recessionary markets
Trend following. Fear creates strong directional moves. Recessions often lead to clean breakdowns or macro-driven trends. ATR helps with stop placement, Bollinger Bands catch explosive exits, and 50/200 EMA confirms trend. Great for FX majors, commodities, and sector ETFs.
Mean reversion. Panic stretches prices far from value. Look for RSI extremes, Stochastic turns, and VWAP bounces. These setups offer quick rebound trades, like the sharp rallies seen after March 2020’s crash. Use tight stops. These fail fast in trending markets.
Options and volatility. Recessions spike implied volatility. Use puts for protection, or straddles and VIX calls for big swings. In 2008 and 2020, traders profited by playing volatility directly. Just beware of post-event IV crush after Fed or CPI releases.
Scalping and intraday. Fast markets favor quick trades. Use 5–15 min charts with VWAP and ATR. Stick to volatile names like SPY or crude oil. Avoid low-volume times. Never hold overnight – news gaps can ruin risk control.
Risk management. When VIX rises, cut size. Use trailing stops. Cap daily losses to 2 percent. Leverage kills when trends flip fast. Survivors in 2020 and 2022 weren’t always right – they just managed risk better.
Use smart trading instruments. Spot volatility with our Heatmap, read real sentiment, scalp using fast brokers, and backtest with real spread data. Track yield curves and PMI shifts early using the Macro Barometer.
| Min Spread EUR/USD, pips | Max Spread EUR/USD, pips | Min Spread GBP/USD, pips | MAX Spread GBP/USD, pips | Raw Spread EUR/USD | Raw Spread GBP/USD | TU overall score | Open an account | |
|---|---|---|---|---|---|---|---|---|
| 0.1 | 0.4 | 0.2 | 0.6 | No | No | 7.89 | Go to broker Your capital is at risk.
|
|
| 0.5 | 0.9 | 0.5 | 1.0 | No | No | 7.52 | Go to broker 80% of retail CFD accounts lose money. |
|
| 0.9 | No | No | No | No | No | 6.81 | Go to broker Your capital is at risk. |
|
| 0.1 | 0.5 | 0.1 | 0.5 | No | No | 6.8 | Go to broker Your capital is at risk. |
|
| 0.7 | 1.2 | 0.9 | 1.4 | 0.1 | 0.3 | 6.74 | Study review |
How to prepare now
Preparing for market volatility isn’t about watching another YouTube guru scream over a chart. It’s about learning to think like a fund manager. You watch how the yield curve bends, not just what CNBC says about it. You read unemployment data like signals in the sand – three weekly climbs in jobless claims? That’s institutions quietly exiting. You learn to time inflation prints, trade pressure under real rules, and build setups that work across FX, indices, and commodities. Bookmark this guide, dive into our broker reviews, and get yourself ready, not just for the next trade, but the next cycle. Explore the difference between inflation and recession, with key market insights to navigate risks, protect assets, and spot investment opportunities.
Conclusion
To truly master what happens in a recession, traders must go beyond headlines and into behavior, macro trends, and volatility mechanics. From GDP decline to market crashes, the recession cycle tests psychology, capital allocation, and timing. But those with a plan, recession-proof strategies, proper risk tools, and multi-asset awareness, can gain where others lose.
FAQs
Is it better to hold cash or invest during a recession?
Holding cash offers stability, but strategic investments in defensive sectors or gold may outperform inflation and preserve purchasing power.
Can traders use ETFs during a recession to manage risk?
Yes, ETFs in sectors like utilities, healthcare, or volatility indexes offer diversification and liquidity ideal for turbulent markets.
How do interest rate changes affect day trading setups?
Rate hikes tighten liquidity and increase volatility, impacting intraday spreads, volume, and reaction to news, especially in FX and indices.
Should I stop trading completely if volatility is too high?
Not necessarily. Reduce size, trade fewer setups, and focus on liquid instruments. High volatility creates opportunity, if managed with discipline.
Editors' Top Picks and Insights

Hunting crypto owners: Why criminals have gone offline

BitMEX is shutting down: Why Trump could not save the exchange

Do governments need crypto workers?

Brent nears $100: Why oil prices are rising

Gram Wallet launch: Can Telegram bring crypto to the masses?

AI without limits: How dangerous are neural networks?
Related Articles
Team that worked on the article
Ciaran Ryan is a veteran financial journalist based in South Africa, where he covers cryptocurrency, mining, stock markets, and governance for Moneyweb. He also hosts the weekly Moneyweb Crypto Podcast.
One of the most widely respected and quoted currency experts, Marc Chandler has been analyzing and advising on the global capital markets for more than 30 years. Throughout his career on Wall Street, Chandler has advised private businesses, hedge funds and asset managers on navigating the foreign exchange market.
Chinmay Soni is a financial analyst with more than 5 years of experience in working with stocks, Forex, derivatives, and other assets. As a founder of a boutique research firm and an active researcher, he covers various industries and fields, providing insights backed by statistical data.
Scalping in trading is a strategy where traders aim to make quick, small profits by executing numerous short-term trades within seconds or minutes, capitalizing on minor price fluctuations.
A day trader is an individual who engages in buying and selling financial assets within the same trading day, seeking to profit from short-term price movements.
Risk management is a risk management model that involves controlling potential losses while maximizing profits. The main risk management tools are stop loss, take profit, calculation of position volume taking into account leverage and pip value.
Bitcoin is a decentralized digital cryptocurrency that was created in 2009 by an anonymous individual or group using the pseudonym Satoshi Nakamoto. It operates on a technology called blockchain, which is a distributed ledger that records all transactions across a network of computers.
Forex trading, short for foreign exchange trading, is the practice of buying and selling currencies in the global foreign exchange market with the aim of profiting from fluctuations in exchange rates. Traders speculate on whether one currency will rise or fall in value relative to another currency and make trading decisions accordingly. However, beware that trading carries risks, and you can lose your whole capital.

-
 Afghanistan
-
 Albania
-
 Algeria
-
 Angola
-
 Argentina
-
 Armenia
-
 Australia
-
 Austria
-
 Azerbaijan
-
 Bahamas
-
 Bahrain
-
 Bangladesh
-
 Belarus
-
 Belgium
-
 Bolivia
-
 Botswana
-
 Brazil
-
 Brunei
-
 Bulgaria
-
 Cambodia
-
 Cameroon
-
 Canada
-
 Chile
Chile
-
 China
China
-
 Colombia
-
 Congo
Congo
-
 Costa Rica
-
 Cote d'Ivoire
-
 Croatia
-
 Cuba
Cuba
-
 Cyprus
-
 Czechia
-
 DR Congo
-
 Denmark
-
 Dominican Republic
-
 Ecuador
-
 Egypt
Egypt
-
 El Salvador
-
 Estonia
-
 Eswatini
-
 Ethiopia
-
 Finland
-
 France
-
 Georgia
-
 Germany
-
 Ghana
Ghana
-
 Greece
-
 Haiti
Haiti
-
 Hong Kong
-
 Hungary
-
 India
India
-
 Indonesia
-
 Iran, Islamic republic
-
 Iraq
Iraq
-
 Ireland
-
 Israel
-
 Italy
Italy
-
 Jamaica
-
 Japan
Japan
-
 Jordan
-
 Kazakhstan
-
 Kenya
Kenya
-
 Korea
Korea
-
 Kuwait
-
 Kyrgyzstan
-
 Laos
Laos
-
 Latvia
-
 Lebanon
-
 Lesotho
-
 Libya
Libya
-
 Lithuania
-
 Luxembourg
-
 Madagascar
-
 Malaysia
-
 Malta
Malta
-
 Mauritius
-
 Mexico
-
 Moldova
-
 Mongolia
-
 Montenegro
-
 Morocco
-
 Mozambique
-
 Myanmar
-
 Namibia
-
 Nepal
Nepal
-
 Netherlands
-
 New Zealand
-
 Nigeria
-
 North Macedonia
-
 Norway
-
 Oman
Oman
-
 Pakistan
-
 Palestine
-
 Panama
-
 Papua New Guinea
-
 Paraguay
-
 Peru
Peru
-
 Philippines
-
 Poland
-
 Portugal
-
 Puerto Rico
-
 Qatar
Qatar
-
 Reunion
-
 Romania
-
 Rwanda
-
 Saudi Arabia
-
 Serbia
-
 Singapore
-
 Slovakia
-
 Slovenia
-
 Somalia
-
 South Africa
-
 Spain
Spain
-
 Sri Lanka
-
 Sweden
-
 Switzerland
-
 Syria
Syria
-
 Taiwan
-
 Tajikistan
-
 Tanzania
-
 Thailand
-
 Trinidad and Tobago
-
 Tunisia
-
 Turkey
-
 UAE
UAE
-
 Uganda
-
 Ukraine
-
 United Kingdom
-
United States
-
 Uruguay
-
 Uzbekistan
-
 Venezuela
-
 Vietnam
-
 Yemen
Yemen
-
 Zambia
-
 Zimbabwe
- Forex
- Crypto
