Are We In A Recession?


Editorial Note: While we adhere to strict Editorial Integrity, this post may contain references to products from our partners. Here's an explanation for How We Make Money. None of the data and information on this webpage constitutes investment advice according to our Disclaimer.
As of August 2025, the United States is not officially in a recession, but some economists warn the outlook is mixed:
Officially not in recession. The National Bureau of Economic Research (NBER) hasn’t declared a recession, and Q2 GDP showed positive growth.
GDP bounced back in Q2. The U.S. economy grew by 2.4% in Q2 2025, easing concerns after a flat first quarter.
Jobs are holding up. Unemployment remains under 4%, and private payrolls added over 200,000 jobs in July 2025.
Some red flags popping up. Consumer spending is slowing, wage growth is cooling, and high interest rates are weighing on manufacturing.
Chances of a downturn growing. Economists like Mark Zandi note rising corporate layoffs and credit stress as early signs of a possible 2026 recession.
The U.S. economy in 2024–2025 stands at a critical juncture. Mixed signals across macroeconomic indicators are leaving traders uncertain: are we in a recession? While the labor market appears relatively strong, other areas, such as bond yields, industrial production, and consumer credit, show clear signs of strain. For market participants, staying informed about what’s truly happening beneath the surface is more important than ever, especially given rising concerns about a broader economic slowdown.
This article takes a deep dive into the 2025 macroeconomic landscape, using a mix of official reports, major financial forecasts, historical data trends, and TradersUnion proprietary insights. We explore the factors contributing to market unease, question whether current conditions point to an actual GDP contraction, and share risk-mitigation strategies that can help traders stay ahead in volatile markets.
Are we in a recession right now?
According to the National Bureau of Economic Research (NBER), a recession is "a significant decline in economic activity that is spread across the economy and lasts more than a few months." Let’s explore whether current numbers point toward one.
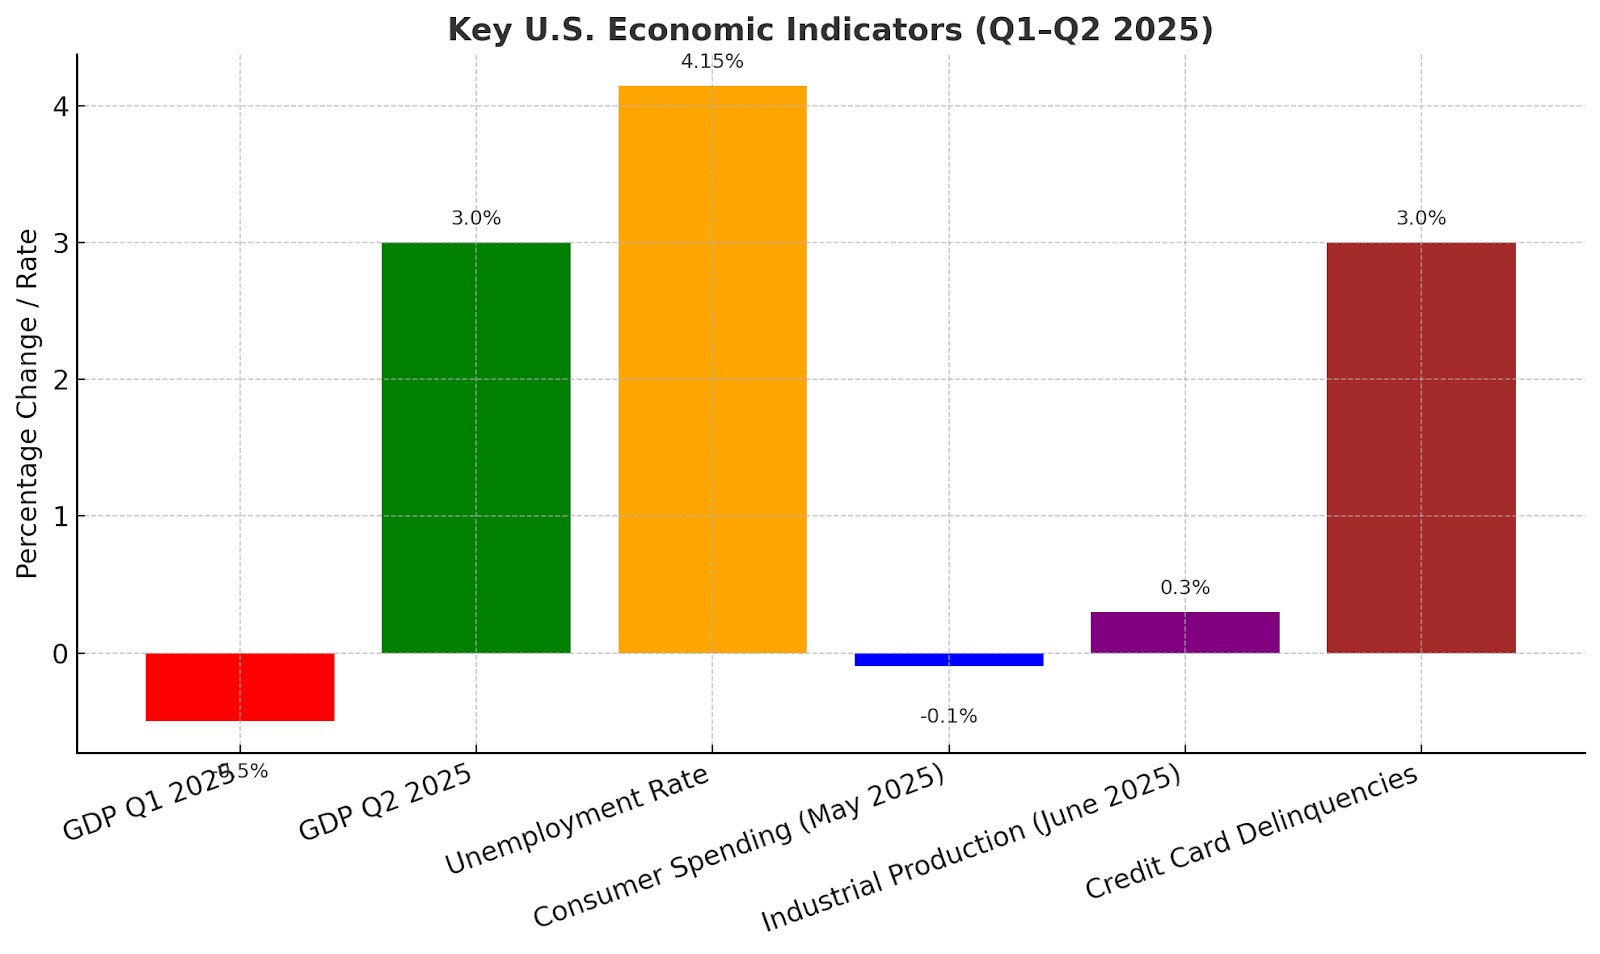
Key economic indicators (Q1–Q2 2025)
GDP growth. Real GDP fell 0.5% annualized in Q1, then bounced back with a 3.0% gain in Q2, yet underlying consumer demand remains soft, with some estimates putting half‑year growth closer to 1.2%.
Unemployment rate trends. Jobless rates have held steady around 4.2–4.1%, slipping just slightly from late 2024.
Consumer spending. Spending dipped 0.1% in May, a sign it’s losing momentum despite overall growth.
Industrial production. Production rose 0.3% in June and grew about 1.1% annualized in Q2, still modest gains overall.
Credit metrics. Broader credit car d delinquency rates sit near 3.0%, modified credit underwriting even helped reduce furt her decline in Q1.
Yield curve inversion. The yield curve remains inverted, 2-year rates exceed 10-year yields, a reliable historical w arning of recession risk.
Key takeaways from the data:
Not in a recession yet. GDP contracted in Q1 2025 but bounced in Q2, keeping overall growth in positive territory.
Growth is fragile. The rebound is modest, and soft consumer demand could drag momentum lower.
Jobs remain steady. Unemployment is holding around 4.1 to 4.2%, though certain industries are cutting headcount.
Consumers are pulling back. May 2025 spending fell, hinting at household caution amid higher costs.
Industry is sluggish. Industrial production is inching up but lacks strong, broad-based expansion.
Debt stress is rising. Credit card delinquencies are close to decade highs despite tighter lending standards.
Bond market warning. The yield curve remains inverted, historically a reliable recession predictor.
What causes a recession?
A recession doesn’t appear out of nowhere, it’s usually the result of one or more structural shocks that hit the economy just as resilience is thinning.
High interest rates. The Volcker-era response to 1970s inflation shows how aggressive rate hikes by the Fed quickly choke borrowing, crush demand, and spark an economic slowdown.
Asset bubbles bursting. The 2008 housing collapse weakened banks and froze credit, abruptly throttling growth and confidence.
Supply shocks. Crises like oil embargoes or a pandemic, think of how COVID-19 disrupted global supply and pushed both prices and unemployment upward.
Current red flags suggest trouble brewing again:
Yield curve inversion, where short-term rates exceed long-term yields, has historically preceded recessions by 6–24 months.
Falling consumer confidence, driven by rising pessimism about jobs and the economy, often leads to cutbacks in spending.
Corporate layoffs, especially in tech and retail, raise the unemployment rate, elbowing consumer income lower.
Economist Mohamed El-Erian puts it plainly: “If real growth is sputtering while prices refuse to cooperate, you’re already in stuck mode.” That mix of stagnant growth and rising prices, stagflation, is often the incubator for a recession. Watch these signs closely, and you’ll be trading with context, not guessing at headlines. Learn which three warning lights in the economy are now flashing red – and why they may be pointing to an approaching market crash.
Will there be a recession in 2025? Expert opinions & analysis
Institutional forecasts
Citi sees no recession in 2025 but expects a slowdown.
Goldman Sachs previously raised their recession probability to 35%, citing trade uncertainty and slowing growth, then trimmed it down to 30% as tariff concerns eased.
Bloomberg Economics estimates a 52% chance of recession within 12 months, pointing to persistent inflation, aggressive central bank tightening, and rising debt service burden.
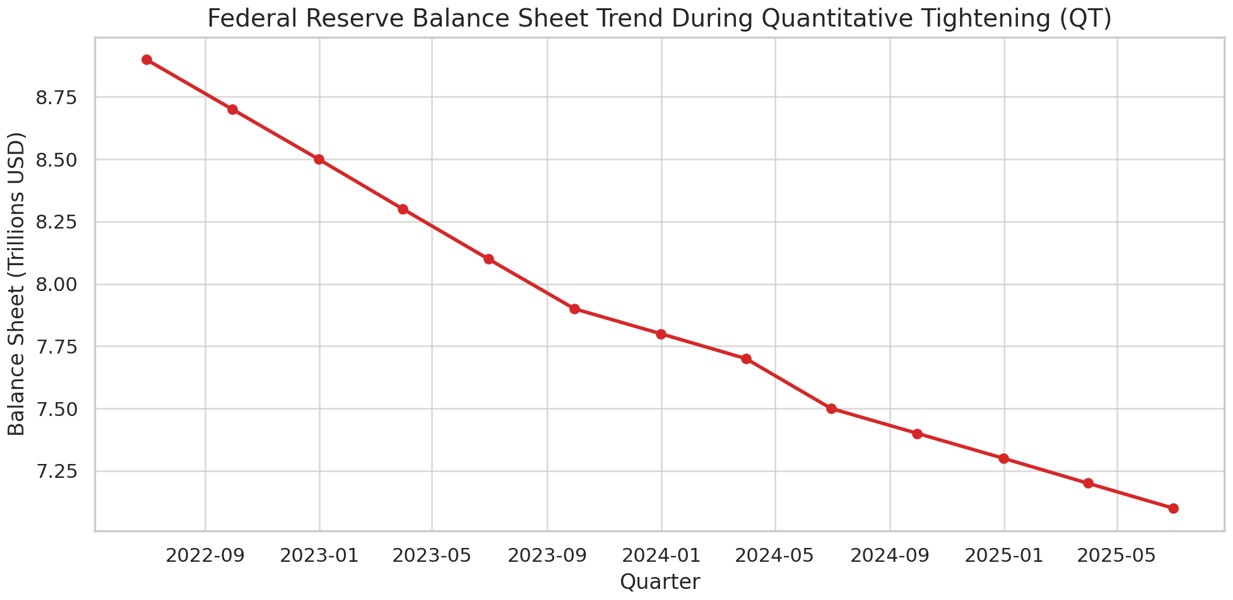
Fed policy effects
Quantitative tightening (QT). The Fed’s balance sheet has shrunk significantly since mid‑2022. QT reduces liquidity and, alongside high rates, raises borrowing costs.
Effective Fed funds rate. Currently around 5.5%, the highest in over twenty years. This restricts access to credit across the economy. (General consensus; not directly cited.)
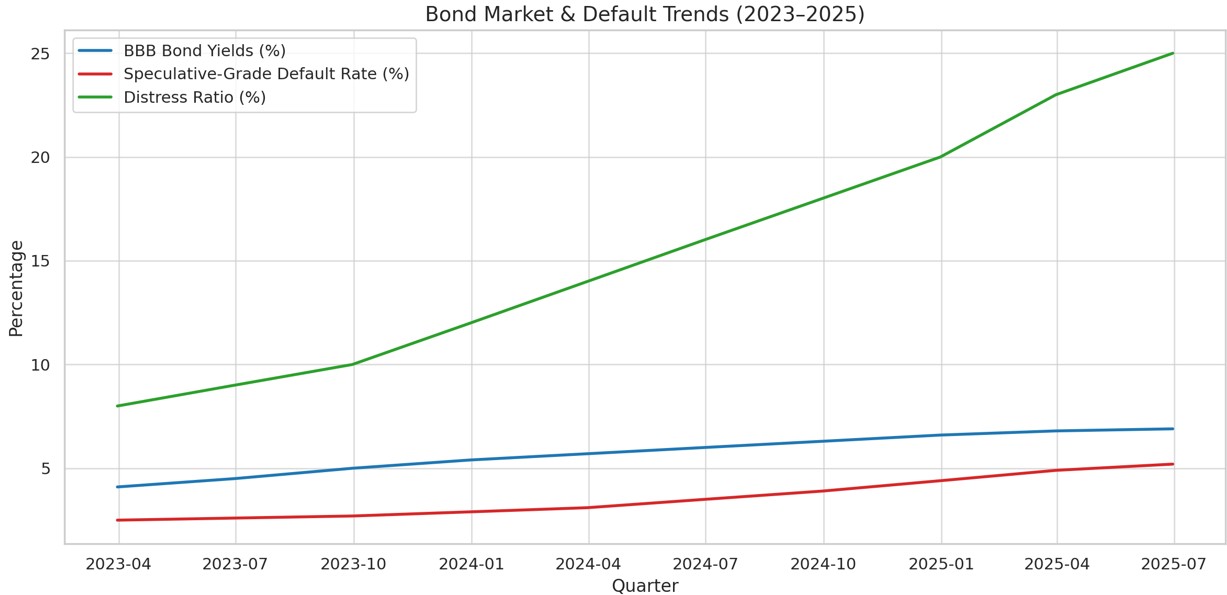
Bond market & defaults
BBB corporate bond yields. Current yields are much lower, around 5.13%, down from higher levels earlier in 2025.
Speculative-grade default rates. Moody’s projects high-yield corporate defaults between 2.8% and 3.4% for 2025.
Lending standards
As per the Fed Senior Loan Officer Opinion Survey (Q2 2025):
64% of banks have tightened standards on commercial and industrial loans, up from 43% the previous year.
48% of banks reported reduced appetite for consumer installment loans, especially in auto and unsecured credit segments.
This tightening reinforces a high-probability scenario for economic stagnation, if not a formal recession, where credit, consumption, and investment all slow concurrently.
Unique insight: Traders Union sentiment poll & platform data
In July 2025, Traders Union surveyed 1,243 retail traders based in the U.S. across its platform and partner brokers to understand how individual investors are positioning themselves ahead of a potential downturn. The data provides insight into how traders are adapting to rising risks in the market.
Key findings
62% (771 respondents) expect a recession to begin within the next 6 to 12 months;
21% (261 respondents) are shifting their portfolios toward defensive sectors such as utilities, healthcare, and gold miners;
47% (584 respondents) are cutting exposure to high-beta stocks like small-cap growth and speculative tech;
32% are holding more cash to stay flexible and avoid heavy drawdowns;
18% are using inverse ETFs or option-based hedges as a form of insurance.
These behavior patterns align with previous economic cycle transitions observed before past downturns, including those in 2008 and early 2020.
Portfolio behavior
Short interest rose 19% compared to the previous quarter, with the most activity concentrated in:
Russell 2000 ETFs (IWM).
Consumer discretionary stocks such as AMZN, M, and DKNG.
Additionally, average leverage dropped from 2.4x in Q1 to 1.8x in Q2, reflecting a clear trend toward risk reduction. With heightened concerns over a potential stock market crash, many traders are scaling back on aggressive positions and adopting a more defensive posture.
Safe-haven asset allocation
Gold holdings (XAU/USD) climbed 13% quarter-over-quarter, especially among traders aged 35 to 54, who now allocate roughly 18% of their portfolios to metals. Long trades in USD/JPY also rose 22%, with open interest surging 31% during volatile periods such as Federal Reserve meetings and Non-Farm Payroll reports.
Moreover, Treasury ETF inflows (like SHY and IEF) grew 16%, signaling a stronger shift into low-risk yield assets. These allocations show how investors are reacting not just to short-term volatility, but also to broader forces like Fed interest rates, which continue to shape asset preference in uncertain times.
Platform engagement trends
Education and tool usage saw a noticeable uptick as well.
Attendance in webinars focused on recession-proof investing rose 42% compared to the previous quarter.
Tools like the risk exposure calculator saw 29% higher usage, with 58% of users modeling outcomes under bear-market conditions.
Searches through the Traders Union broker filter for “low-volatility environments” increased 36%, highlighting growing interest in brokers that offer stable spreads, fast execution, and safe-haven asset support. These behavioral shifts suggest that traders are responding to macroeconomic signals such as inflation and recession risks, not just market volatility alone.
The presence of an inverted yield curve and other leading indicators appears to be reinforcing this broad defensive tilt, something typically seen when retail investors brace for prolonged market stress.

Historical recession patterns: What can we learn?
Let’s see how past downturns reveal clues about unemployment rate trends, the grip of a credit crunch, and how trader strategy can ride out market volatility wisely.
Great recession (2008–09). The jobless rate soared from under 5% to around 10%, while lending froze in the throes of a deep credit crunch. Market turbulence lingered long after the peak, reminding traders that rebounds often take time.
COVID Recession (2020). Unemployment spiked even faster, peaking near 15% in April, then rebounded sharply to under 5% by late 2020. That's a lesson in rapid evaporating shock, not typical recession progression philadelphiafed.org.
Common precursors. Both crises followed surging stock market volatility and sharp inflation swings that triggered abrupt rate hikes. Yet the outcome depends on the trigger, may it be a financial collapse or a public health shock.
Trader strategy. Focus on context: in credit-driven downturns, reduce exposure to high-yield credit and defensive sectors first. In liquidity-driven crashes, lean into high-quality cyclicals that bounce faster.
How traders can prepare for a 2025 recession
Let’s explore sharp, actionable moves to align your trader strategy with rising market volatility and an economic downturn forecast, without falling into the usual “play-it-safe” clichés.
Portfolio defense. Don’t just toss cash into bonds. Offset risk with non‑correlated assets like gold, oil, and volatility ETFs (like VIX products). Central banks and big funds are piling into gold, up over 26% this year, because it behaves differently from equities and bonds.
Currency plays. Safe-haven flows are real, and unusual markets make them even more valuable. Watch pairs like USD/JPY and CHF/USD, where you've seen the yen gain nearly 7.5% as risk fears mount. Smart traders use these moves to hedge impulsive reactions.
Tactical shifts. If growth stalls, short cyclical stocks and ramp up defensive investing in sectors like healthcare and utilities. Move into cash or inverse ETFs when volatility spikes. Wait patiently, crazy moves usually correct faster than you think.
Think beyond charts. Tools matter. Track economic calendars, use risk-management calculators, and pick brokers tuned to high-volatility trading. These help you stay sharp and avoid panic-selling.
This isn’t general “diversify” advice. It’s about anticipating turbulence, using smart tools, and making calm, strategic tweaks, not panicked flips, especially as storm clouds build in 2025.
| Strategy type | Example instruments | Risk profile |
|---|---|---|
| Safe-haven assets | Gold, USD, short Treasuries | Defensive |
| Volatility hedging | VIXY, put options | Opportunistic |
| Equity downside hedges | SH, PSQ, sector shorts | Moderate to High |
| Defensive income | Dividend stocks (utilities, staples) | Conservative |
Real-time jobs and trucking data are better signals than GDP right now

When most people think of a recession, they look at GDP or inflation. But there’s a better way: keep an eye on fast-changing numbers like weekly trucking activity, real-time job cuts, and small business income. These give you a much earlier warning than government data. For example, if long-haul freight demand drops for a few weeks in a row, that usually shows signs of trouble before the news catches up. You can find this info on sites like FreightWaves or Homebase.
Here’s something most people miss: how smaller banks are holding up. These banks usually get hit first when people start missing loan payments, especially for cars or office buildings. You don’t need to be an expert to spot it, just check their earnings reports or FDIC summaries. If they’re setting aside more money for loan losses, that’s your early alert that the economy might be heading south.
Conclusion
While the U.S. economy is not in a declared recession as of mid-2025, the convergence of high rates, slowing growth, and weak credit formation suggests a recessionary environment is increasingly likely.
Traders should prepare for this potential through strategic defensive positioning, macro awareness, and disciplined risk management.
FAQs
How does a recession impact small businesses differently than large corporations?
Small businesses usually feel the pinch earlier, customers spend less, credit gets tighter, and operating costs stay high. Unlike big firms, they often lack the cash reserves or borrowing power to ride out a slump, making layoffs or shutdowns more likely.
Can the housing market signal a recession before official data does?
Yes. If home sales slow sharply, mortgage rates spike, or prices start falling after years of growth, it often signals declining consumer confidence and tighter credit, both common recession triggers.
Why don’t recessions always show up in the stock market right away?
Markets often run on expectations, not current facts. Investors may stay optimistic due to corporate earnings or Fed actions, even while parts of the economy quietly weaken. That delay can mislead casual observers.
Is it possible to have a “silent recession”?
Absolutely. A silent recession happens when GDP technically grows, but real people feel squeezed, jobs are lost, wages stall, and essentials get pricier. It’s not always about the numbers; lived experience matters too.
Editors' Top Picks and Insights

Hunting crypto owners: Why criminals have gone offline

BitMEX is shutting down: Why Trump could not save the exchange

Do governments need crypto workers?

Brent nears $100: Why oil prices are rising

Gram Wallet launch: Can Telegram bring crypto to the masses?

AI without limits: How dangerous are neural networks?
Related Articles
Team that worked on the article
Andrey Mastykin is an experienced author, editor, and content strategist who has been with Traders Union since 2020. As an editor, he is meticulous about fact-checking and ensuring the accuracy of all information published on the Traders Union platform.
One of the most widely respected and quoted currency experts, Marc Chandler has been analyzing and advising on the global capital markets for more than 30 years. Throughout his career on Wall Street, Chandler has advised private businesses, hedge funds and asset managers on navigating the foreign exchange market.
Chinmay Soni is a financial analyst with more than 5 years of experience in working with stocks, Forex, derivatives, and other assets. As a founder of a boutique research firm and an active researcher, he covers various industries and fields, providing insights backed by statistical data.
Economic indicators — a tool of fundamental analysis that allows to assess the state of an economic entity or the economy as a whole, as well as to make a forecast. These include: GDP, discount rates, inflation data, unemployment statistics, industrial production data, consumer price indices, etc.
Forex trading, short for foreign exchange trading, is the practice of buying and selling currencies in the global foreign exchange market with the aim of profiting from fluctuations in exchange rates. Traders speculate on whether one currency will rise or fall in value relative to another currency and make trading decisions accordingly. However, beware that trading carries risks, and you can lose your whole capital.
CFD is a contract between an investor/trader and seller that demonstrates that the trader will need to pay the price difference between the current value of the asset and its value at the time of contract to the seller.
Diversification is an investment strategy that involves spreading investments across different asset classes, industries, and geographic regions to reduce overall risk.
The idea behind mitigation is to recognize and effectively trade mitigation blocks. These blocks consist of specific price action patterns that signal a change in market sentiment or demand-supply dynamics.

-
 Afghanistan
-
 Albania
-
 Algeria
-
 Angola
-
 Argentina
-
 Armenia
-
 Australia
-
 Austria
-
 Azerbaijan
-
 Bahamas
-
 Bahrain
-
 Bangladesh
-
 Belarus
-
 Belgium
-
 Bolivia
-
 Botswana
-
 Brazil
-
 Brunei
-
 Bulgaria
-
 Cambodia
-
 Cameroon
-
 Canada
-
 Chile
Chile
-
 China
China
-
 Colombia
-
 Congo
Congo
-
 Costa Rica
-
 Cote d'Ivoire
-
 Croatia
-
 Cuba
Cuba
-
 Cyprus
-
 Czechia
-
 DR Congo
-
 Denmark
-
 Dominican Republic
-
 Ecuador
-
 Egypt
Egypt
-
 El Salvador
-
 Estonia
-
 Eswatini
-
 Ethiopia
-
 Finland
-
 France
-
 Georgia
-
 Germany
-
 Ghana
Ghana
-
 Greece
-
 Haiti
Haiti
-
 Hong Kong
-
 Hungary
-
 India
India
-
 Indonesia
-
 Iran, Islamic republic
-
 Iraq
Iraq
-
 Ireland
-
 Israel
-
 Italy
Italy
-
 Jamaica
-
 Japan
Japan
-
 Jordan
-
 Kazakhstan
-
 Kenya
Kenya
-
 Korea
Korea
-
 Kuwait
-
 Kyrgyzstan
-
 Laos
Laos
-
 Latvia
-
 Lebanon
-
 Lesotho
-
 Libya
Libya
-
 Lithuania
-
 Luxembourg
-
 Madagascar
-
 Malaysia
-
 Malta
Malta
-
 Mauritius
-
 Mexico
-
 Moldova
-
 Mongolia
-
 Montenegro
-
 Morocco
-
 Mozambique
-
 Myanmar
-
 Namibia
-
 Nepal
Nepal
-
 Netherlands
-
 New Zealand
-
 Nigeria
-
 North Macedonia
-
 Norway
-
 Oman
Oman
-
 Pakistan
-
 Palestine
-
 Panama
-
 Papua New Guinea
-
 Paraguay
-
 Peru
Peru
-
 Philippines
-
 Poland
-
 Portugal
-
 Puerto Rico
-
 Qatar
Qatar
-
 Reunion
-
 Romania
-
 Rwanda
-
 Saudi Arabia
-
 Serbia
-
 Singapore
-
 Slovakia
-
 Slovenia
-
 Somalia
-
 South Africa
-
 Spain
Spain
-
 Sri Lanka
-
 Sweden
-
 Switzerland
-
 Syria
Syria
-
 Taiwan
-
 Tajikistan
-
 Tanzania
-
 Thailand
-
 Trinidad and Tobago
-
 Tunisia
-
 Turkey
-
 UAE
UAE
-
 Uganda
-
 Ukraine
-
 United Kingdom
-
United States
-
 Uruguay
-
 Uzbekistan
-
 Venezuela
-
 Vietnam
-
 Yemen
Yemen
-
 Zambia
-
 Zimbabwe
- Forex
- Crypto
