Inflation vs Recession: Key Differences Every Trader Should Know (2026 Analysis)


Editorial Note: While we adhere to strict Editorial Integrity, this post may contain references to products from our partners. Here's an explanation for How We Make Money. None of the data and information on this webpage constitutes investment advice according to our Disclaimer.
Inflation means persistent price growth with sectors like energy and commodities outperforming, while recession signals economic contraction favoring defensive stocks and bonds. Traders must track CPI, GDP, and yield curves, rotating strategies to protect capital and seize opportunities as market conditions shift.
The two forces, inflation and recession, represent opposing trends that shape the direction of the economic cycle. Inflation signals a general rise in prices, while recession reflects a broader contraction in economic activity. For active traders, this isn’t just about theory. Knowing whether the economy is expanding or shrinking helps define portfolio allocation, risk exposure, and which sectors to lean into or avoid. That's why many investors often explore questions like what the difference between inflation and recession is, especially during periods of heightened volatility and policy uncertainty.
This guide helps break down those contrasts, diving into the causes, effects, and real-time market responses to both inflation and recession. With current data and expert insights, it offers traders a framework to navigate changing conditions more confidently, by knowing not just where we are in the cycle, but also where we might be headed next.
Definitions: Inflation and recession explained
Inflation
Inflation is the general rise in prices across an economy, usually tracked through metrics like the CPI inflation rate and the Personal Consumption Expenditures (PCE) index.
A gradual increase in prices is normal in a growing economy, but rapid spikes can erode purchasing power and disrupt business planning.
Inflation can be driven by demand outpacing supply, cost increases in production, or expansionary Federal Reserve policy that keeps interest rates low for too long.
Central banks often respond with rate hikes to slow inflation, but overly aggressive action can trigger a slowdown or even a recession.
Recession
A recession is a broad and sustained decline in economic activity, typically lasting at least two quarters.
The National Bureau of Economic Research (NBER) considers multiple data points, but a GDP contraction over consecutive quarters is one of the most widely recognized signs.
Recessions are often accompanied by falling employment, reduced consumer spending, and heightened market volatility as investors react to uncertainty.
Historical examples show that recessions can result from tightening Federal Reserve policy, external shocks, or financial market instability.
Core differences between inflation and recession
| Metric | Inflation | Recession |
|---|---|---|
| GDP | Rising or overheating; real GDP growth often exceeds 2.5% | Declining; negative or near-zero GDP growth for 2+ quarters |
| Employment | Strong labor market; unemployment rate typically below 4% | Job losses increase; unemployment rate often rises above 5% |
| Interest Rates | Central banks hike rates to control price levels (e.g., Fed Funds Rate > 5%) | Rates are reduced to stimulate demand; policy may shift below 2% |
| Consumer Sentiment | Can be optimistic short-term, cautious long-term due to cost-of-living rise | Generally pessimistic; reduced spending and confidence in job security |
| Market Volatility | Driven by uncertainty over rate hikes and inflation expectations | Driven by earnings downgrades, layoffs, and fear of prolonged contraction |
| Corporate Earnings | Nominal revenues may rise but margins shrink due to cost pressures | Revenues and profits often fall as demand weakens |
| Bond Yields | Rising yields; short-term bonds yield more during tightening cycles | Yields decline; yield curve often inverts before recession |
| Stock Market Trends | Sector rotation into value, energy, and materials | Defensive sectors (utilities, healthcare, staples) tend to outperform |
| Consumer Behavior | Increased borrowing; higher household expenses (food, housing, fuel) | Decreased spending; focus on saving and debt reduction |
| Government Policy | Fiscal restraint or selective subsidies; tighter monetary stance | Expansionary policies: rate cuts, stimulus checks, QE programs |
The table above shows the primary difference between inflation and recession using macroeconomic indicators that traders should closely monitor.
Inflationary environment
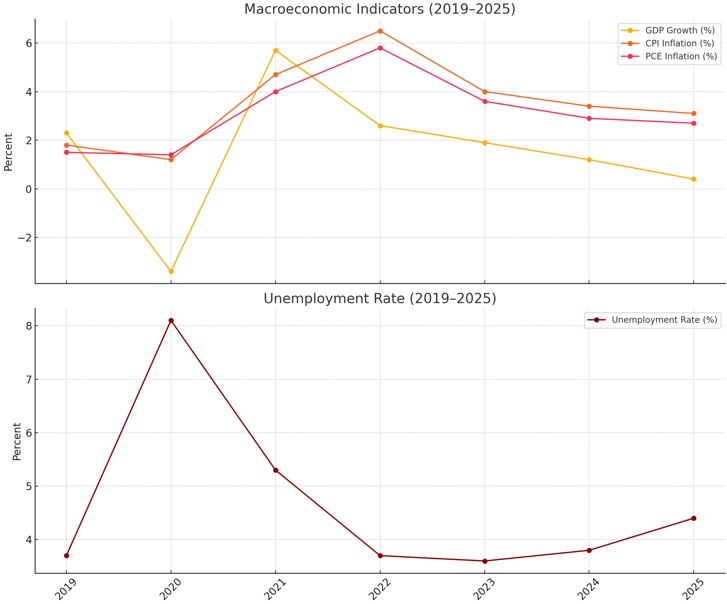
CPI growth. U.S. CPI rose by 6.5% in 2022 and gradually cooled to 3.1% by mid-2025.
Wage growth. Median weekly earnings increased by 4.7% YoY in early 2025, according to BLS.
Energy & Food inflation. Energy prices surged over 40% YoY in 2022; in 2025, they remain volatile with Brent crude at $89/barrel.
Housing. Shelter costs rose 7.9% YoY in 2023 and have remained sticky due to low supply.
Recessionary environment
GDP contraction. Real GDP fell by -0.4% in Q1 2025, while the second quarter remained flat, indicating potential stagflation in 2025, where both inflation and stagnation coexist.
Unemployment rate. Rose from 3.8% (Jan 2025) to 4.4% (July 2025), a sign of weakening labor markets.
Retail sales. Core retail sales have declined 2.1% YoY as of June 2025, indicating reduced consumer activity.
Corporate profits. S&P 500 earnings projected to fall 7% YoY in Q3 2025, per FactSet estimates.

Real spending signals weakness
Data from the FRED shows that real personal consumption expenditures (PCE) in Q2 2025 grew by just 0.2%, a significant slowdown compared to 1.5% in Q4 2024. This drop shows how consumer spending is cooling, even as headline inflation eases.
Slower consumption, weaker profits, and cautious hiring suggest that the economy could be entering a phase where deflation risks begin to re-emerge, especially if demand continues to weaken without renewed stimulus.
| Indicator | Inflation | Recession |
|---|---|---|
| Real GDP | +2.5%–4% typical during expansion | 0% or negative for 2+ quarters |
| Unemployment | Below 4% (tight labor market) | Rises above 4.5% (currently at 4.4%) |
| Wage growth | 4–5% YoY | Slows to 1–2% or negative in real terms |
| Consumer spending | High but pressured by prices | Low or falling (Retail Sales -2.1% YoY) |
| Interest rates | Fed Funds Rate at 5.25% (restrictive) | Often cut to stimulate demand (historically <2%) |
What causes inflation vs what triggers a recession
Here’s a clearer breakdown of each force, and how they can intertwine to shape the economic landscape:
Inflation drivers
Excess demand. When consumer and business spending outpaces what the economy can supply, prices climb, and the CPI inflation rate captures that upward pressure, especially when supply chains struggle to catch up.
Supply chain disruptions. Anything from logistics snags to geopolitical tensions can curtail supply, increasing costs and feeding into general price rises.
Expansionary monetary and fiscal policy. When the Federal Reserve policy stays ultra-low for too long or governments inject large-scale stimulus, the extra money chasing limited goods can worsen inflation, even if growth isn’t robust.
Recession triggers
Aggressive interest rate hikes. The Fed often raises rates to rein in inflation. However, that can choke off borrowing and spending, leading to a GDP contraction.
Deleveraging cycles. When businesses or consumers prioritize paying down debt, spending drops. That slowdown, combined with tighter credit, can trigger a downturn.
Global shocks. Surprise events, like a commodity price spike, pandemic, or geopolitical tension, can rapidly curb demand and trigger widespread market volatility.
Fed insight
As of early 2025, the Federal Reserve expressed caution about the near-term outlook. Its Beige Book noted that “higher import tariffs…were putting upward pressure on prices,” highlighting how policy shifts can fuel inflation even as growth softens, effectively toeing the line between inflation and recession.
How inflation and recession affect financial markets
Inflation and recession shape market behavior in fundamentally different ways. Each macroeconomic condition alters investor expectations, risk appetite, and asset class performance. Traders must stay nimble and adapt to the shifting landscape using both macro data and intermarket analysis.
Equities
Inflationary periods
High inflation squeezes corporate profit margins, especially in sectors tied to rising input costs or dependent on long-term earnings. However, companies with pricing power and exposure to commodities often benefit. In 2025:
Energy (XLE). +14% YTD
Materials (XLB). +9%
Financials (XLF). supported by wider interest margins
These sectors tend to outperform when inflationary pressure persists.
Recessionary periods
As growth slows, capital shifts into stable, defensive industries that provide essential goods and services. Key performers in 2025 included:
Consumer Staples (XLP). +4.5% YTD
Healthcare (XLV). +3.7%
Utilities (XLU). +4.9%
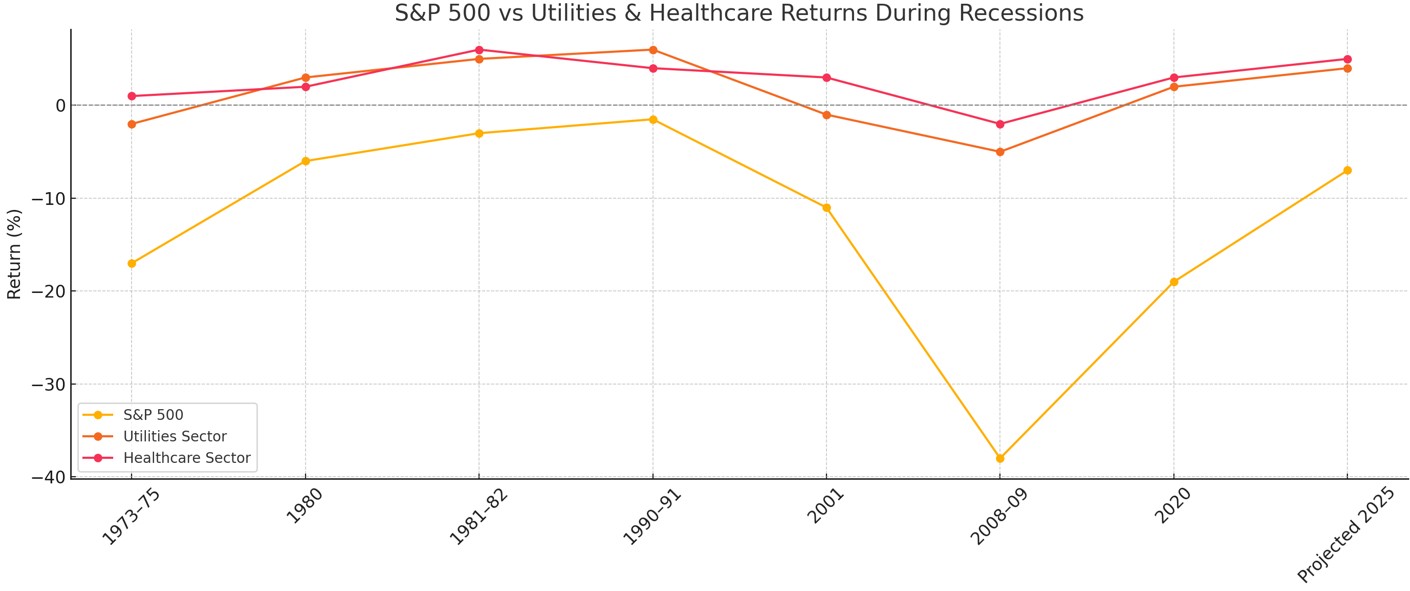
These sectors have historically done well during downturns. In fact, Utilities and Healthcare beat the S&P 500 in 7 of the last 8 downturns, making them reliable recession-proof assets.
Bonds
During inflation surges, bond yields tend to rise as investors demand higher returns to preserve purchasing power. To combat this, policymakers often respond with monetary tightening, which includes raising interest rates and scaling back balance sheet assets.
By June 2025, the 10-year U.S. Treasury yield climbed to 4.2%, driven by persistent inflation and a hawkish stance from the Fed. Meanwhile, short-term bonds also saw yield increases, with the Federal Funds Rate holding steady at 5.25%.
As a result, long-duration bonds lost ground. TLT, the 20+ Year Treasury ETF, posted an -8% return by mid-year. Investors seeking protection looked to TIPS and floating-rate notes for stability.
Recessionary environment
As economic activity slows, demand for safe-haven assets rises. Investors pull back from riskier holdings, driving up prices of government bonds and pushing yields down. This flight to safety caused a notable yield curve inversion in mid-2025:
2-year Treasury yield. 4.4%
10-year Treasury yield. 3.7%
That 70-basis-point inversion signaled an upcoming economic slowdown, a trend observed ahead of 7 of the last 8 recessions. Long-dated Treasuries, municipal bonds, and investment-grade corporates gained demand, while high-yield spreads widened due to growing credit risks.
Commodities
Commodities have long served as a hedge against rising prices. As raw material costs increase, across energy, food, and metals, commodity prices typically follow. In 2025:
Gold reached $2,100/oz, driven by inflation, weak real yields, and central bank intervention (notably from China and emerging markets)
Brent Crude rose to $89/barrel, lifted by OPEC+ supply cuts and geopolitical tensions
Agricultural goods like wheat and soybeans jumped 8–12% YoY amid climate issues and transport delays
Industrial metals such as copper and aluminum rallied between 2022–2023, then steadied in 2025 as global manufacturing eased but infrastructure spending continued.
Note: In high-inflation environments, commodities often outperform traditional financial assets. ETFs like DBC and GSG, as well as direct futures contracts, offer solid exposure during these periods.
Recessionary environment
In a recession, demand weakens across the board. With factories slowing down, travel declining, and shoppers pulling back, prices for most commodities start to drop, even if supply is still limited.
Analysts expect Brent Crude to dip below $74/barrel in a mild global contraction, with demand falling by over 1.1 million barrels per day. Gold remains a defensive asset but could see modest pullbacks if inflation expectations decline.
Industrial metals like copper are particularly exposed. A 15–25% decline in early recession phases is common due to slumping construction and factory output. Energy stocks, especially in oil and gas, often lag unless they’re supported by strong contracts and cash positions.
One dramatic example: in 2008, oil prices fell from $140 to below $40 in under six months. Today, traders watch Chinese manufacturing data and global PMIs for early signs of similar shifts in consumer sentiment.
Forex
When inflation runs hot, Forex markets respond mostly to interest rate differences. Central banks that act quickly by raising rates attract global capital, which strengthens their currency.
In 2025, the U.S. Dollar Index rose to 104.6, buoyed by continued Fed tightening and a 5.25% Fed Funds Rate. Global inflows into U.S. Treasuries and money markets further lifted the dollar.
EUR/USD declined toward 1.07, pressured by slower ECB hikes and weaker European manufacturing. Emerging market currencies like the BRL and ZAR also fell due to inflation spikes and capital flight.
Macro trend. From 2022 to 2025, the dollar showed strong negative correlation with both gold (-0.78) and U.S. equities (-0.61), making it a go-to hedge during inflation cycles.
When growth slows and risk appetite fades, the currency market pivots toward safety. Traders unwind high-yield positions and favor currencies seen as stable:
USD/JPY fell from 145 to 139.2.
USD/CHF dropped from 0.92 to 0.89.
While the dollar may hold up early in a recession, it often softens if the Fed begins easing. Countries with low debt, trade surpluses, and manageable inflation typically see capital inflows.
In Q2 2025, currency volatility surged, with CVIX rising 22% YoY. This spike reflected heightened uncertainty and sharp intraday moves, common when markets are sensitive to headlines around growth, inflation, and unemployment rate shifts.
How traders should adjust strategies in inflationary vs recessionary environments
In inflation
When the CPI inflation rate stays elevated, traders need to protect purchasing power and returns.
Rotate into inflation hedges like commodities, energy stocks, and Treasury Inflation-Protected Securities (TIPS), which tend to hold value as prices rise.
Prioritize value stocks over growth stocks, as companies with steady cash flow and pricing power can adjust to inflation without eroding margins.
Use options to manage market volatility, protective puts or covered calls can help offset sudden swings driven by inflation data releases or shifts in Federal Reserve policy.
In recession
During a GDP contraction, preserving capital is as important as seeking returns.
Shift allocations toward defensive sectors like utilities, healthcare, and consumer staples, which tend to hold up better when spending slows.
Hold more cash or invest in low-volatility ETFs to reduce drawdowns while waiting for clearer entry points.
Look for bottom-fishing opportunities in high-quality stocks trading below intrinsic value, patience often pays when the broader market is in decline.
Trader insight
According to Traders Union’s 2025 market commentary, mixing tactical hedging with strategic positioning is key. Their data showed that portfolios blending inflation hedges during high CPI inflation rate periods and rotating into defensive sectors during GDP contraction phases outperformed single-strategy approaches by 6 to 8% annually. This underscores that adaptability, not just prediction, is the real edge in shifting economic climates.
Real-world case studies
Let’s unpack two real scenarios that illustrate how shifts in macroeconomic indicators should shape your investment strategy, and how to stay ahead of stock market corrections when central banks tighten unexpectedly.
Example 1: 2008 recession vs 2022 inflation shock
2008’s plunge. The Great Financial Crisis triggered a deep GDP contraction of about 5%. The situation spiraled as credit dried up and sentiment collapsed.
2022's inflation turmoil. By contrast, high inflationary pressure, not financial collapse, led to wild swings. Markets endured steep drops, some of the sharpest since 2008, but the pain was tied to rising prices and market volatility, not credit freezing.
Trader takeaway. When monetary tightening is aimed at curbing inflation, you need a different playbook than during banking crises. Inflation-born corrections are slower and more nuanced.
Example 2: COVID-19 recession (2020) vs post-pandemic inflation (2021–22)
2020 crash. Markets fell sharply within weeks as a stock market correction unfolded. The Fed countered with historic stimulus and rate cuts, stabilizing the system.
2021–22 inflation wave. Inflation surged due to supply chain disruptions and excessive fiscal spending. Central banks pivoted to rate hikes instead of bailouts.
Trader takeaway. Recovery from a shock can be rapid if liquidity flows properly, whereas inflation demands more patience and adjusted positioning.
Can inflation and recession happen at the same time?
Yes. Inflation and recession can overlap in a phase called stagflation, where prices rise even as growth slows. The U.S. saw this in the 1970s, with GDP contracting, unemployment near 9%, and inflation above 13%. In mid-2025, inflation hovers around 3%, GDP growth is near 1.2%, and unemployment is edging toward 5%, prompting warnings of stagflation-lite. This economic slowdown, partly driven by earlier monetary tightening, requires traders to adapt. The mix demands defensive positioning: shorten bond duration, hold TIPS or inflation-linked bonds, and focus on income-generating assets while avoiding speculative plays during potential stock market corrections.
Inflation hedges behave differently during a recessionary equity downturn

In 2025, it’s risky to think inflation hedges like gold or TIPS will automatically protect your portfolio during a recession. When inflation stays sticky while the economy slows, commodities can behave unpredictably. Instead of treating them as safety nets, watch how commodities move relative to stocks using something like the CRB Index versus S&P 500 ratio. That gives you a clue when real assets are about to run ahead of the market, offering short bursts of return even in tough cycles.
One thing beginners often miss is what happens in the bond market when credit stress builds up. It’s not just about rates going up or down. If you notice junk bond spreads narrowing while job losses rise, that’s a red flag. It often means the market is being supported by liquidity, not real growth. In that setup, safer long-term bonds and high-quality stocks quietly start to perform better while everyone else is chasing noisy sectors. Keep an eye on leading credit indicators rather than just past economic data.
Conclusion
Inflation signals overheating; recession signals contraction.
Watch macroeconomic indicators such as CPI, PCE, yield curve, unemployment, and PMI.
Adapt quickly: shift to commodities and value stocks in inflation; lean into defensives and bonds in recession.
Monitor Federal Reserve policy and consumer sentiment to anticipate shifts.
Use Traders Union tools to backtest strategies, compare bond yields, and model stagflation scenarios. Knowing the difference between inflation and recession could be the key to navigating the next stock market correction.
FAQs
What is worse: inflation or recession?
It depends. Inflation erodes real income, but recessions destroy jobs. The worst-case is stagflation, where both occur.
Can inflation lead to a recession?
Yes. When central banks respond to inflation with rate hikes, demand can fall, triggering recession.
How does the Fed handle inflation vs recession?
It raises rates and reduces liquidity during inflation, and cuts rates and expands the balance sheet during recessions.
How can traders hedge during these periods?
Use TIPS, gold, commodity ETFs for inflation; Treasuries, defensives, and cash for recession protection.
Editors' Top Picks and Insights

Bitcoin mining is getting greener, but the debate isn't over

Asia's largest IPO: How CXMT became China's most valuable company

Global fintech in 2026: Three trends that matter

From Jesus Christ to aliens: Polymarket's most absurd prediction markets

Hunting crypto owners: Why criminals have gone offline

BitMEX is shutting down: Why Trump could not save the exchange
Related Articles
Team that worked on the article
Dan Blystone began his trading career in 1998 as an arbitrage clerk on the floor of the Chicago Mercantile Exchange (CME). He later traded bond and Eurex futures at proprietary firms such as Altea Trading, gaining valuable experience in high-frequency trading and risk management.
One of the most widely respected and quoted currency experts, Marc Chandler has been analyzing and advising on the global capital markets for more than 30 years. Throughout his career on Wall Street, Chandler has advised private businesses, hedge funds and asset managers on navigating the foreign exchange market.
Chinmay Soni is a financial analyst with more than 5 years of experience in working with stocks, Forex, derivatives, and other assets. As a founder of a boutique research firm and an active researcher, he covers various industries and fields, providing insights backed by statistical data.
An investor is an individual, who invests money in an asset with the expectation that its value would appreciate in the future. The asset can be anything, including a bond, debenture, mutual fund, equity, gold, silver, exchange-traded funds (ETFs), and real-estate property.
Volatility refers to the degree of variation or fluctuation in the price or value of a financial asset, such as stocks, bonds, or cryptocurrencies, over a period of time. Higher volatility indicates that an asset's price is experiencing more significant and rapid price swings, while lower volatility suggests relatively stable and gradual price movements.
Forex trading, short for foreign exchange trading, is the practice of buying and selling currencies in the global foreign exchange market with the aim of profiting from fluctuations in exchange rates. Traders speculate on whether one currency will rise or fall in value relative to another currency and make trading decisions accordingly. However, beware that trading carries risks, and you can lose your whole capital.
Index in trading is the measure of the performance of a group of stocks, which can include the assets and securities in it.
Bitcoin is a decentralized digital cryptocurrency that was created in 2009 by an anonymous individual or group using the pseudonym Satoshi Nakamoto. It operates on a technology called blockchain, which is a distributed ledger that records all transactions across a network of computers.

-
 Afghanistan
-
 Albania
-
 Algeria
-
 Angola
-
 Argentina
-
 Armenia
-
 Australia
-
 Austria
-
 Azerbaijan
-
 Bahamas
-
 Bahrain
-
 Bangladesh
-
 Belarus
-
 Belgium
-
 Bolivia
-
 Botswana
-
 Brazil
-
 Brunei
-
 Bulgaria
-
 Cambodia
-
 Cameroon
-
 Canada
-
 Chile
Chile
-
 China
China
-
 Colombia
-
 Congo
Congo
-
 Costa Rica
-
 Cote d'Ivoire
-
 Croatia
-
 Cuba
Cuba
-
 Cyprus
-
 Czechia
-
 DR Congo
-
 Denmark
-
 Dominican Republic
-
 Ecuador
-
 Egypt
Egypt
-
 El Salvador
-
 Estonia
-
 Eswatini
-
 Ethiopia
-
 Finland
-
 France
-
 Georgia
-
 Germany
-
 Ghana
Ghana
-
 Greece
-
 Haiti
Haiti
-
 Hong Kong
-
 Hungary
-
 India
India
-
 Indonesia
-
 Iran, Islamic republic
-
 Iraq
Iraq
-
 Ireland
-
 Israel
-
 Italy
Italy
-
 Jamaica
-
 Japan
Japan
-
 Jordan
-
 Kazakhstan
-
 Kenya
Kenya
-
 Korea
Korea
-
 Kuwait
-
 Kyrgyzstan
-
 Laos
Laos
-
 Latvia
-
 Lebanon
-
 Lesotho
-
 Libya
Libya
-
 Lithuania
-
 Luxembourg
-
 Madagascar
-
 Malaysia
-
 Malta
Malta
-
 Mauritius
-
 Mexico
-
 Moldova
-
 Mongolia
-
 Montenegro
-
 Morocco
-
 Mozambique
-
 Myanmar
-
 Namibia
-
 Nepal
Nepal
-
 Netherlands
-
 New Zealand
-
 Nigeria
-
 North Macedonia
-
 Norway
-
 Oman
Oman
-
 Pakistan
-
 Palestine
-
 Panama
-
 Papua New Guinea
-
 Paraguay
-
 Peru
Peru
-
 Philippines
-
 Poland
-
 Portugal
-
 Puerto Rico
-
 Qatar
Qatar
-
 Reunion
-
 Romania
-
 Rwanda
-
 Saudi Arabia
-
 Serbia
-
 Singapore
-
 Slovakia
-
 Slovenia
-
 Somalia
-
 South Africa
-
 Spain
Spain
-
 Sri Lanka
-
 Sweden
-
 Switzerland
-
 Syria
Syria
-
 Taiwan
-
 Tajikistan
-
 Tanzania
-
 Thailand
-
 Trinidad and Tobago
-
 Tunisia
-
 Turkey
-
 UAE
UAE
-
 Uganda
-
 Ukraine
-
 United Kingdom
-
United States
-
 Uruguay
-
 Uzbekistan
-
 Venezuela
-
 Vietnam
-
 Yemen
Yemen
-
 Zambia
-
 Zimbabwe
- Forex
- Crypto
- Inflation and recession explained
- Differences between inflation and recession
- What causes inflation vs what triggers a recession
- How inflation and recession affect financial markets
- How traders should adjust strategies
- Real-world case studies
- Can inflation and recession happen at the same time?
- Expert opinion
- Conclusion
- FAQs
