What is the Rectangular Bearish Pattern?


Editorial Note: While we adhere to strict Editorial Integrity, this post may contain references to products from our partners. Here's an explanation for How We Make Money. None of the data and information on this webpage constitutes investment advice according to our Disclaimer.
A bearish rectangle pattern in technical analysis is a chart pattern formed when the price is bounded by parallel support and resistance levels. This pattern indicates a consolidation period where the price moves within a horizontal trading range, and bearish breakdown is expected.
Pros: Predictable entry and exit points; Applicable across various asset classes and timeframes
Cons: Risk of false breakouts; Performance varies with market conditions
Success Rate: From 76% to 85%, indicating a high reliability under the right conditions
Use Case: Particularly effective in down-trending markets where it can identify consolidation and predict subsequent drops, allowing traders to strategically plan short positions
Bearish rectangle is one of those patterns that can significantly enhance your trading success. I've spent years analyzing charts and trading, and I can attest to the potential that pattern trading holds. However, every trader faces a crucial challenge - distinguishing between temporary fluctuations and genuine trading opportunities.
I’ll try to explain the bearish rectangle and how it’s used. I’ll walk you through its basics, how to identify it, and, most importantly, how to trade it effectively. Whether you are a seasoned trader or just starting, understanding this pattern could be a valuable addition to your trading arsenal. The goal is for you to not only know what a bearish rectangle is, but also how to use it to refine your trading strategy and hopefully secure more consistent returns.
Understanding the Bearish Rectangle chart pattern
The bearish rectangle pattern is a classic consolidation form in technical analysis, often observed during downtrends. It emerges between two horizontal levels - a resistance and a support, indicating a temporary balance between supply and demand (sellers and buyers respectively).
Why It Forms
This pattern usually appears as the market reassesses its direction, marked by a trading range where neither side dominates. I like to think of it as a brief breather on the road down, signaling a build-up of selling pressure.
Detection and Interpretation
Identifying a bearish rectangle involves you being able to recognize the following:
A prior downtrend
Price fluctuation between clear horizontal boundaries
Decreased trading volume, suggesting hesitance among traders
A breakout below the support, especially with increased volume, confirms the pattern and signals a continuation of the bearish trend. The chart below shows how the price stabilizes before breaking downwards.
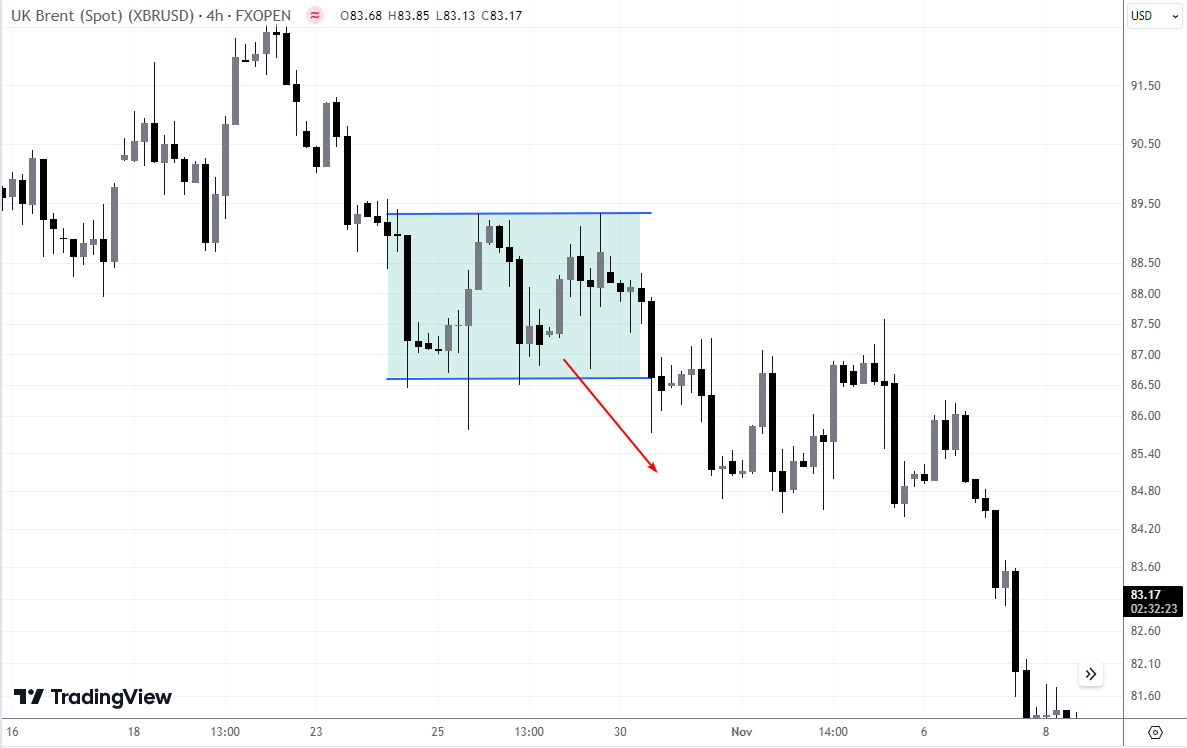 A chart showing a bearish rectangle pattern followed by a breakout downwards
Supply and Demand Dynamics
During the pattern’s development, supply matches demand, creating a standoff. However, in a complete bearish rectangle pattern, the prevailing bearish sentiment will hint that demand is insufficient to counteract the supply. This will set the stage for a potential price drop. Once it happens, congratulations, a bearish rectangle is confirmed.
How to trade the Bearish Rectangle
Employ a mix of strategic confirmation signals, monitor relevant news, and choose the appropriate timeframes and assets for the best outcomes.
Confirmations: Always wait for a decisive breakout below the rectangle's support level, accompanied by a surge in trading volume as a confirmation
News: Keep an eye on market news. Economic reports and geopolitical events can dramatically affect market sentiment and influence the price. For instance, adverse news can expedite the bearish continuation, intensifying the breakout’s impact
Timeframes and Assets: I prefer trading this pattern on time frames ranging from 1-hour to daily charts, which tend to show clearer signals. While the pattern applies to various assets like forex pairs, cryptocurrencies, and commodities, I've noticed that each class responds differently to technical setups. Adapt your strategy based on the asset’s characteristics
How to place Stop Loss
Stop loss helps you mitigate risk. In a bearish rectangle, I typically set my stop loss just slightly above the rectangle's resistance level. This position makes sure that if the breakout is a false alarm and the price reverses back into the rectangle or even breaks upwards, my losses will be limited.
Below, you’ll find the previously shown chart, but with a stop loss placement shown.
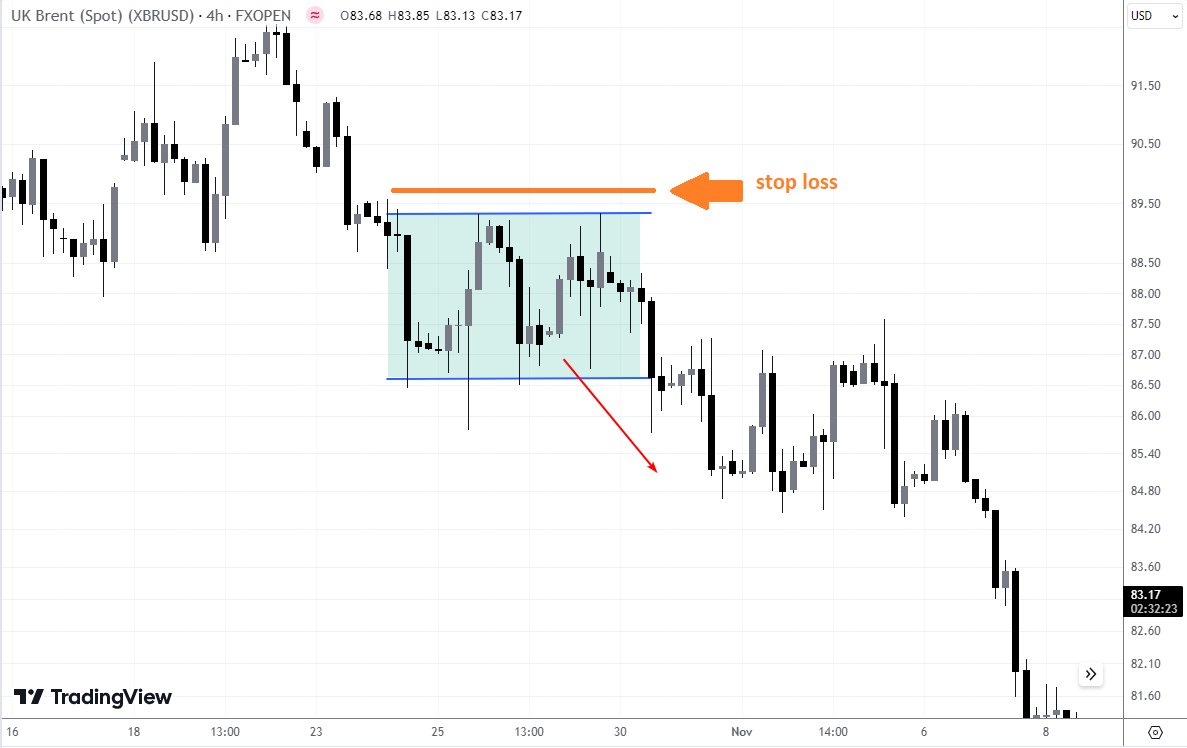 The classic approach is to set a stop loss outside the rectangle
The key here is to give the trade enough room to breathe without exposing yourself to unnecessary risk. For example, placing the stop loss a few pips above the resistance accommodates potential price spikes due to market volatility. I also consider recent highs within the rectangle or any other significant resistance points just above it to fine-tune the stop loss placement.
Expert Opinion

If you follow the classic approach of setting a stop loss outside the rectangle, this way you can worsen the Risk:Reward Ratio. Therefore, it may make sense for you to move to a slower timeframe and choose a shorter stop loss to improve the R:R ratio.
To become better at placing stop loss just right, read our article Stop Loss Order - How to Use It Correctly to Earn More?
Bearish Rectangle Pattern target: Where to place Take Profit (TP)
Setting the take profit (TP) point is crucial for locking in profits at the optimal moment. Personally, I calculate the TP by measuring the height of the rectangle and then projecting that distance downward from the point where the price breaks below the support level, and placing my TP somewhere in that range. This approach is grounded in the principle that the price movement within the rectangle can mirror the breakout's potential.
For instance, if the rectangle formation spans a price range of 50 pips, I set my TP about between 15-50 pips below the breakout level. This helps ensure that the TP is realistic and aligns with the pattern's historical behavior. Still, it’s not a set-in-stone kind of thing. Consider the overall market conditions and adjust the TP accordingly, especially in fast-moving or volatile markets.
Trading the Bearish Rectangle: Example 1
The chart below shows the consolidation of late summer 2023, when the US dollar strengthened against the pound on the back of high inflation and high interest rates from the Fed and Bank of England.
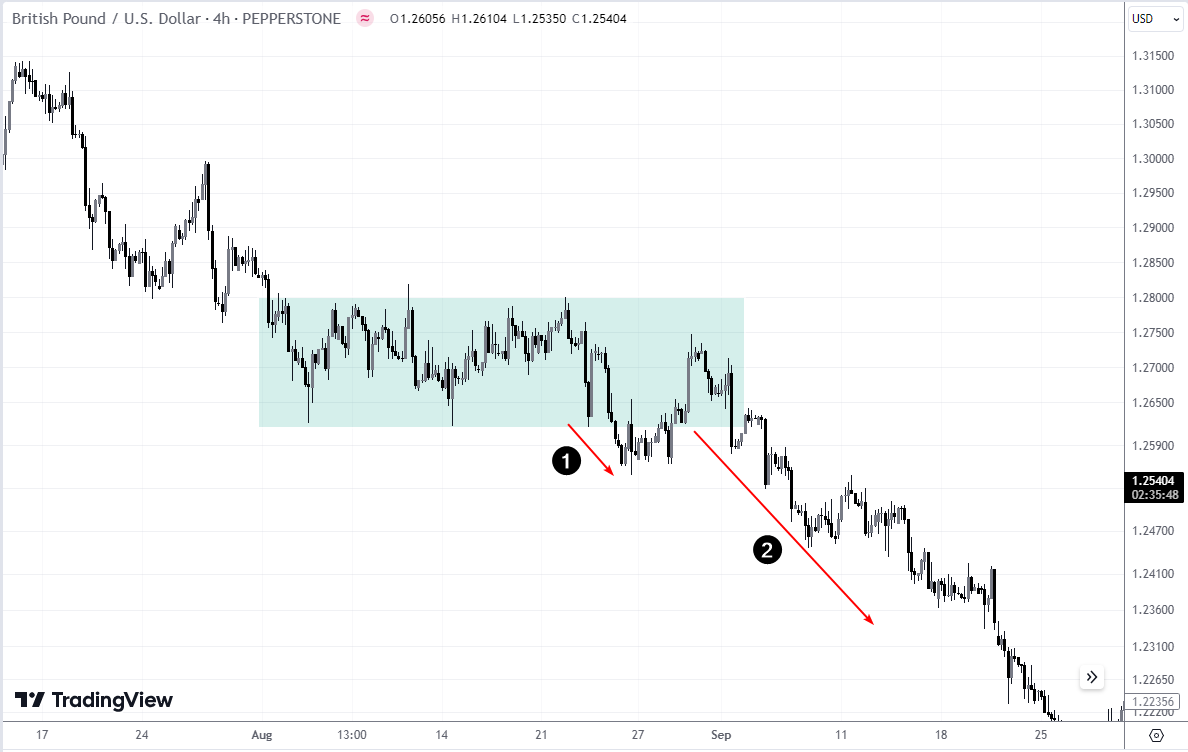 GBP/USD pair on a 4-hour chart displaying a bearish rectangle pattern
The green square indicates a bearish rectangle pattern as a period of consolidation that lasted until more news emerged and the downtrend continued. Note that the exit from the bearish rectangle occurred in the form of two impulses (1 and 2): the first had only minor success, the second led to a sustained decline in price.
Key Observations
Price Levels: The resistance level was consistently around 1.28000, while the support hovered near 1.26000
Resistance Tests: Multiple, indicating strong selling pressure
Support Tests: Fewer, showing weakening demand
Trading Strategy
Entry: I would place a sell order just below the support level at approximately 1.25900, ensuring the breakout is confirmed by increased volume or a bearish candle closure below support
Stop Loss: Placing the stop loss just above the resistance level at about 1.28100 provides a cushion against false breakouts
Take Profit: Aiming for a conservative profit target, I would project a 70 pips drop to around 1.25200
Trading the Bearish Rectangle: Example 2
This example on the EUR/USD 30-minute chart showcases a bearish rectangle where the pattern isn't perfectly formed, emphasizing the need for precise strategy execution.
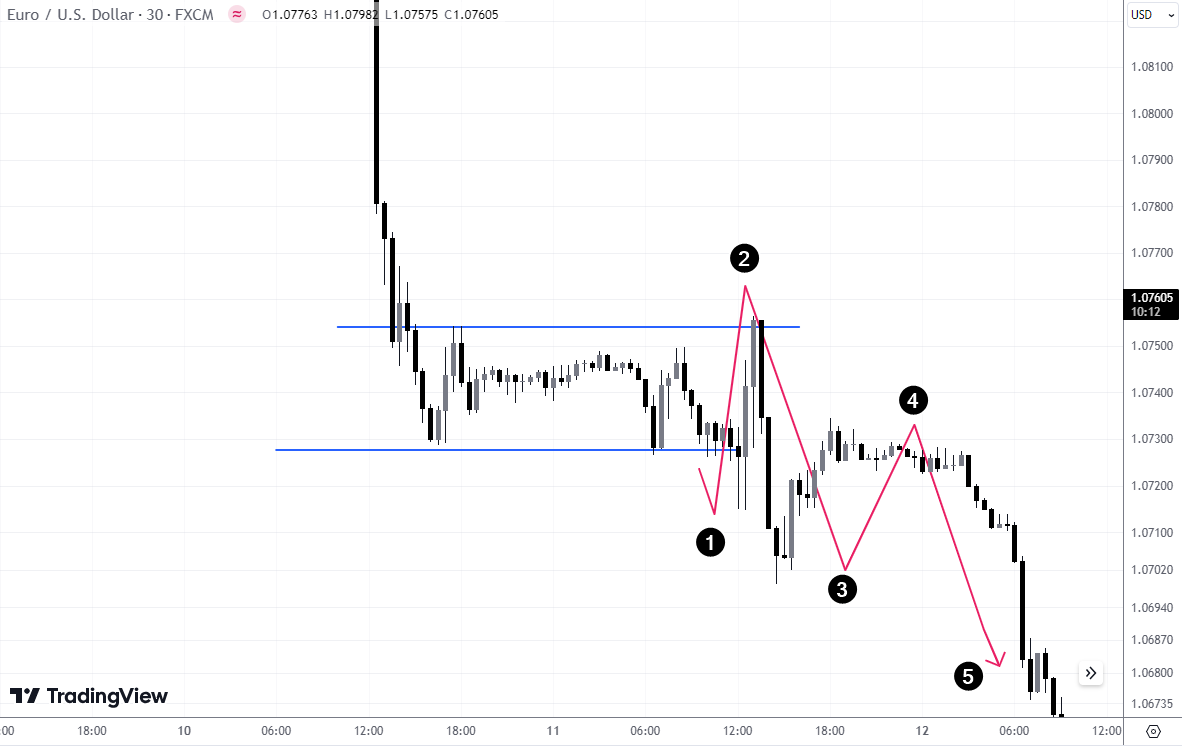 EUR/USD 30-minute chart showcasing an imperfect bearish rectangle pattern
Finding rectangular formations intraday can also be due to distortions caused by the fact that markets have different volatility at different times of the day.
Chart Description
The resistance level is around 1.0755, with the support level at approximately 1.0720
The resistance is slightly broken at one point highlighted with point 2 on the chart, which makes this bearish rectangle imperfect
Trading Insights
Profitability: Yes, profit is possible here, but the non-ideal form means higher risk. A tight stop loss just above the resistance at 1.0758 is crucial to manage this risk
Take Profit: Ideally you’d aim for about a nice, clean 1.0720. Obviously, if you notice that what was once support starts acting as a new resistance, and the price keeps getting rejected there, you may consider opening a new sell position
For Beginners: Due to its complexity and tighter price movements, beginners might consider skipping this trade for clearer setups
In my opinion, when patterns like this appear less than ideal, having stringent stop losses and realistic take profit goals becomes even more important to safeguard against sudden market movements.
Trading the Bearish Rectangle: Example 3
In this example, we observe Litecoin/USD on a 30-minute chart. The bearish rectangle is formed, offering a strategic entry point for traders.
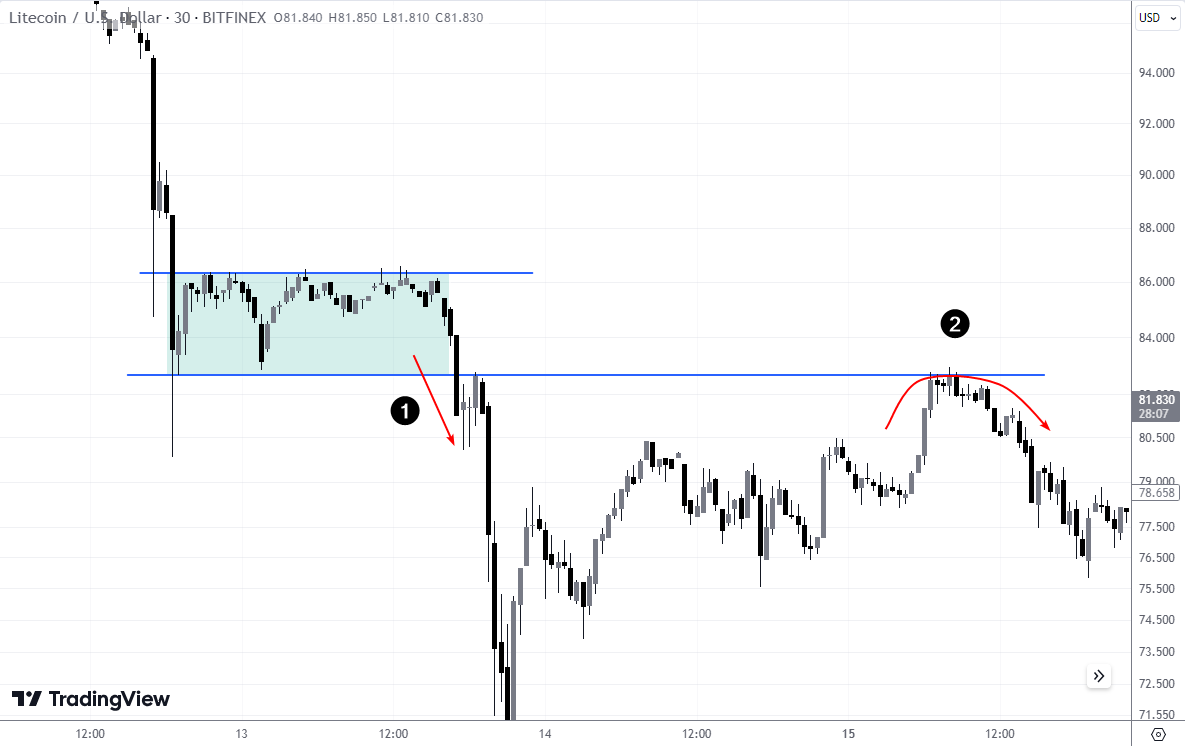 Litecoin/USD 30-minute chart showcasing a bearish rectangle pattern
When the price breaks the rectangle downwards, it means that market participants come to a consensus that the asset is overpriced – so this green zone may act as resistance in the future.
Chart Description
Timing and Price Levels: The rectangle forms between the resistance at $86 and support at 81.83
Key Observations: After consolidation, a sharp breakdown occurs at point 1, followed by a significant recovery that tests the breakdown at point 2 and gets rejected
Trading Strategy
Entry: I would initiate a sell position just above $81, confirming the bearish sentiment
Stop Loss: Set just above the re-test level at approximately $82.5 to minimize risk
Take Profit: I’d aim for a profit target potentially at around $76. After the previous support turned resistance is tested again at point 2 and gets rejected, it creates an opportunity for another sell position
This setup uses the test of the breakdown to validate the bearish momentum, which is crucial for confirming entry points in volatile markets like cryptocurrencies.
Best Forex brokers


What Is the success rate of the Rectangle Pattern?
According to research by renowned analyst Tom Bulkowski, the success rate of rectangle patterns ranges from 76% to 85%, which I’d personally consider quite high as far as trading patterns go.
Why is this important? Because it means that this is a good pattern to familiarize yourself with and become adept at recognizing. Statistically speaking, if you became the master of recognizing the bearish rectangle pattern (and the bullish one while you’re at it, whose success rate is just 1% lower than its bearish counterpart), as well as how to react to it, almost 4 out of 5 of your trades would be successful.
These are extremely impressive numbers. And numbers don’t lie.
Should I trade the Bearish Rectangle pattern?
I can’t help it, I love my pros and cons lists. So here they are for the bearish rectangle pattern:
- Pros:
- Cons:
- Predictability: The bearish rectangle provides clear entry and exit points, making it easier to plan trades
- Versatility: This pattern can be applied across various asset classes and timeframes, enhancing its utility
- Success rate: With a success rate as high as around 80%, this pattern will deliver what it promises more often than not
- False Breakouts: There is a risk of false breakouts, which can lead to losses if not properly managed with stop losses
- Market Conditions: Performance can vary in different market conditions. The pattern may not always conform to expectations in highly volatile or illiquid markets
- Imperfect Visuals: Not unlike many other patterns, the bearing rectangle pattern can get a “crooked look”, breaking that nice-looking rectangle shape. This can make it be a bit tricky to recognize reliably
I do recommend learning about this pattern and using it yourself, but with a caveat. The caveat is that if you’re a beginner, I advise you to only trade clear-cut rectangle patterns. If it breaks its form and you’re not sure, better to steer clear of it.
Expert Opinion

I love the bearish rectangle pattern. It’s one of the more reliable tools in my arsenal. If you can manage to become good at spotting fake breakouts and placing stop loss and take profit, it can become a welcome addition to yours as well.
Summary
The bearish rectangle pattern is a valuable tool in technical analysis, offering structured trading opportunities with clear entry and exit points. Still, I’d advise traders to be cautious of false breakouts and adapt to varying market conditions. Proper risk management and market awareness are essential.
FAQs
What is the rectangle pattern in a chart?
The rectangle pattern in a chart indicates a period where the price moves within a confined horizontal range, showing consolidation between support and resistance levels before a breakout occurs.
Is a rectangle bullish or bearish?
A rectangle can be either bullish or bearish. A bullish rectangle forms during an uptrend and predicts continued upward movement after consolidation, while a bearish rectangle forms during a downtrend and signals a further decline.
How is a bearish rectangle formed?
A bearish rectangle is formed during a downtrend when prices consolidate between parallel support and resistance levels, moving sideways before continuing the downward trend after breaking below support.
Do trading rectangle patterns actually work?
Yes, trading rectangle patterns can be effective, especially when combined with proper risk management and confirmatory indicators. They are known for their high success rate, providing predictable entry and exit points.
Editors' Top Picks and Insights

SK Hynix debuts on Nasdaq: Largest U.S. offering by foreign company

SpaceX falls out of orbit: Does anyone still want Musk’s stock?

The crypto IPO problem: How high-profile listings became investor traps

U.S. Bitcoin reserve: Trump’s unrealized crypto promise

Aiming for leadership: Payment giants prepare a new stablecoin

Proof of Reserves: the new standard for cryptocurrency exchanges
Related Articles
Team that worked on the article
Vuk stands at the forefront of financial journalism, blending over six years of crypto investing experience with profound insights gained from navigating two bull/bear cycles. A dedicated content writer, Vuk has contributed to a myriad of publications and projects.
Dr. BJ Johnson is a PhD in English Language and an editor with over 15 years of experience. He earned his degree in English Language in the U.S and the UK.
Mirjan Hipolito is a journalist and news editor at Traders Union. She is an expert crypto writer with five years of experience in the financial markets.
Index in trading is the measure of the performance of a group of stocks, which can include the assets and securities in it.
Volatility refers to the degree of variation or fluctuation in the price or value of a financial asset, such as stocks, bonds, or cryptocurrencies, over a period of time. Higher volatility indicates that an asset's price is experiencing more significant and rapid price swings, while lower volatility suggests relatively stable and gradual price movements.
Options trading is a financial derivative strategy that involves the buying and selling of options contracts, which give traders the right (but not the obligation) to buy or sell an underlying asset at a specified price, known as the strike price, before or on a predetermined expiration date. There are two main types of options: call options, which allow the holder to buy the underlying asset, and put options, which allow the holder to sell the underlying asset.
Forex trading, short for foreign exchange trading, is the practice of buying and selling currencies in the global foreign exchange market with the aim of profiting from fluctuations in exchange rates. Traders speculate on whether one currency will rise or fall in value relative to another currency and make trading decisions accordingly. However, beware that trading carries risks, and you can lose your whole capital.
Bitcoin is a decentralized digital cryptocurrency that was created in 2009 by an anonymous individual or group using the pseudonym Satoshi Nakamoto. It operates on a technology called blockchain, which is a distributed ledger that records all transactions across a network of computers.

-
 Afghanistan
-
 Albania
-
 Algeria
-
 Angola
-
 Argentina
-
 Armenia
-
 Australia
-
 Austria
-
 Azerbaijan
-
 Bahamas
-
 Bahrain
-
 Bangladesh
-
 Belarus
-
 Belgium
-
 Bolivia
-
 Botswana
-
 Brazil
-
 Brunei
-
 Bulgaria
-
 Cambodia
-
 Cameroon
-
 Canada
-
 Chile
Chile
-
 China
China
-
 Colombia
-
 Congo
Congo
-
 Costa Rica
-
 Cote d'Ivoire
-
 Croatia
-
 Cuba
Cuba
-
 Cyprus
-
 Czechia
-
 DR Congo
-
 Denmark
-
 Dominican Republic
-
 Ecuador
-
 Egypt
Egypt
-
 El Salvador
-
 Estonia
-
 Eswatini
-
 Ethiopia
-
 Finland
-
 France
-
 Georgia
-
 Germany
-
 Ghana
Ghana
-
 Greece
-
 Haiti
Haiti
-
 Hong Kong
-
 Hungary
-
 India
India
-
 Indonesia
-
 Iran, Islamic republic
-
 Iraq
Iraq
-
 Ireland
-
 Israel
-
 Italy
Italy
-
 Jamaica
-
 Japan
Japan
-
 Jordan
-
 Kazakhstan
-
 Kenya
Kenya
-
 Korea
Korea
-
 Kuwait
-
 Kyrgyzstan
-
 Laos
Laos
-
 Latvia
-
 Lebanon
-
 Lesotho
-
 Libya
Libya
-
 Lithuania
-
 Luxembourg
-
 Madagascar
-
 Malaysia
-
 Malta
Malta
-
 Mauritius
-
 Mexico
-
 Moldova
-
 Mongolia
-
 Montenegro
-
 Morocco
-
 Mozambique
-
 Myanmar
-
 Namibia
-
 Nepal
Nepal
-
 Netherlands
-
 New Zealand
-
 Nigeria
-
 North Macedonia
-
 Norway
-
 Oman
Oman
-
 Pakistan
-
 Palestine
-
 Panama
-
 Papua New Guinea
-
 Paraguay
-
 Peru
Peru
-
 Philippines
-
 Poland
-
 Portugal
-
 Puerto Rico
-
 Qatar
Qatar
-
 Reunion
-
 Romania
-
 Rwanda
-
 Saudi Arabia
-
 Serbia
-
 Singapore
-
 Slovakia
-
 Slovenia
-
 Somalia
-
 South Africa
-
 Spain
Spain
-
 Sri Lanka
-
 Sweden
-
 Switzerland
-
 Syria
Syria
-
 Taiwan
-
 Tajikistan
-
 Tanzania
-
 Thailand
-
 Trinidad and Tobago
-
 Tunisia
-
 Turkey
-
 UAE
UAE
-
 Uganda
-
 Ukraine
-
 United Kingdom
-
United States
-
 Uruguay
-
 Uzbekistan
-
 Venezuela
-
 Vietnam
-
 Yemen
Yemen
-
 Zambia
-
 Zimbabwe
- Forex
- Crypto
