Types Of Forex Trading Charts


Editorial Note: While we adhere to strict Editorial Integrity, this post may contain references to products from our partners. Here's an explanation for How We Make Money. None of the data and information on this webpage constitutes investment advice according to our Disclaimer.
The types of price charts available on most trading platforms include:
Basic charts: Line charts, Bar charts, Candlestick charts
Additional charts: Renko charts, Heiken Ashi charts, Tick charts, Kagi charts
In this article, we'll compare different types of Forex trading charts, including line, bar, and candlestick charts. We’ll cover their pros and cons, how they help traders understand price movements and trends, and the role of additional charts like Renko and Heiken Ashi in providing a complete market analysis.
Basic types of charts
The most common types of charts for Forex trading are:
Line charts
Bar charts
Candlestick charts
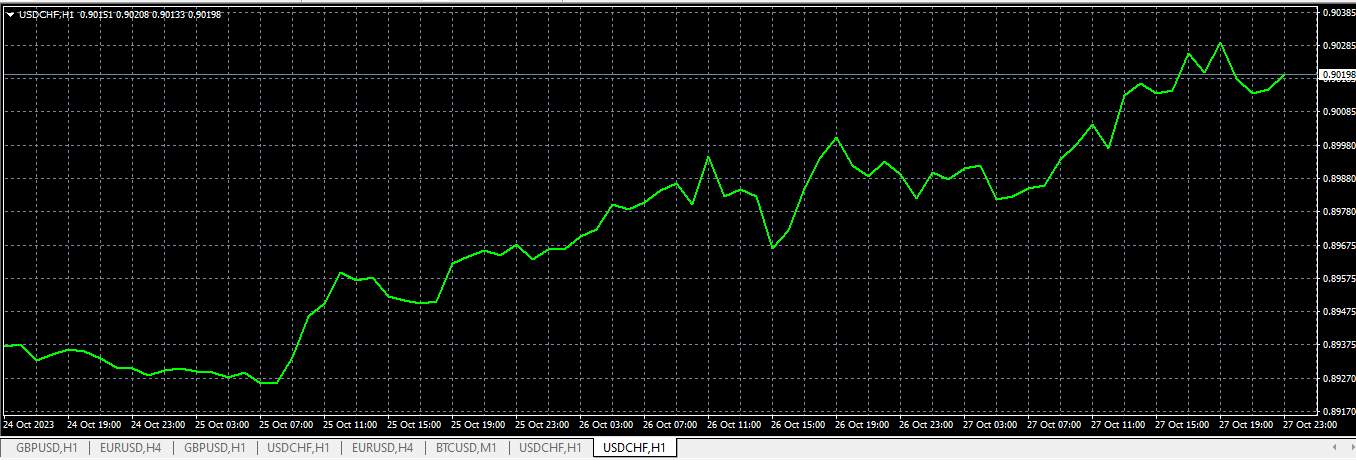
Line charts
Line charts are the simplest form of price representation. They connect the opening, closing, high, and low prices for each time period, providing a general overview of price movements.
- Pros
- Cons
- Ease of use: Line charts are simple to understand and use, consisting of a single line connecting the opening, closing, high, and low prices for each time period.
- Overall view: They offer an overall view of price movement, helpful for beginner traders learning about the market.
- Versatility: Line charts can be used for various trading strategies, including technical analysis, fundamental analysis, and news-based trading, making them suitable for traders of all experience levels.
- Lack of detail: Line charts do not show the opening, closing, high, and low prices for each time period, which can make identifying trends and patterns difficult.
- Susceptible to noise: They can be affected by noise from small price fluctuations, making it challenging to identify real trends.
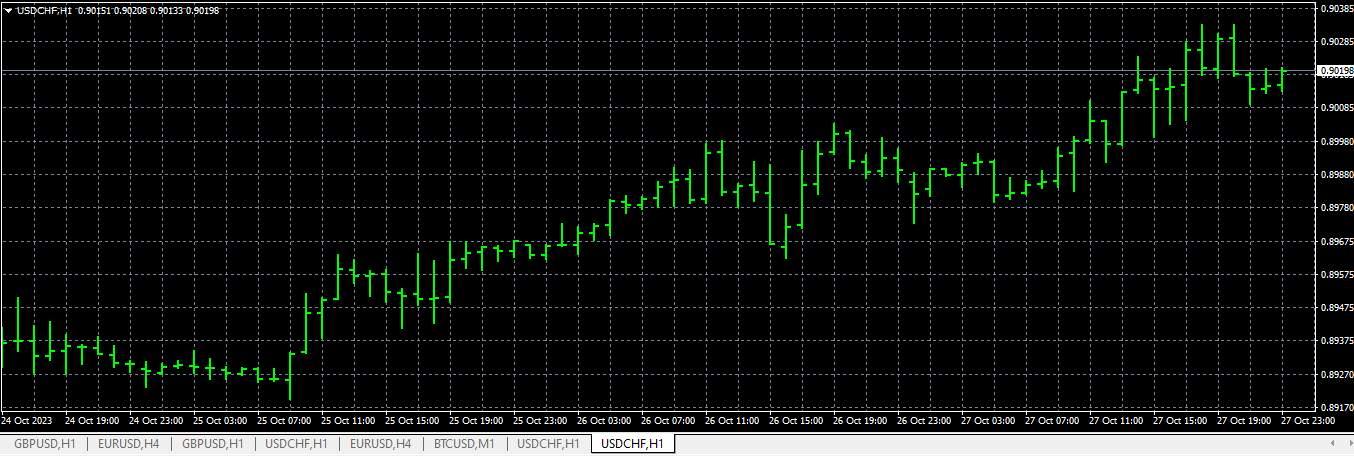
Bar charts
Bar charts offer more detail than line charts, using vertical bars to show the opening, closing, high, and low prices for each time period. They are useful for identifying trends and patterns.
- Pros
- Cons
- Detailed information: Bar charts show the opening, closing, high, and low prices for each time period, providing a better understanding of price movement.
- Trend identification: They are useful for identifying trends and patterns, such as uptrends, downtrends, triangles, and flags.
- Versatility: Suitable for various trading strategies, including technical analysis, fundamental analysis, and news-based trading.
- Complexity for beginners: Bar charts can be more complex to understand than line charts.
- Susceptible to noise: Like line charts, they can be affected by noise from small price fluctuations.
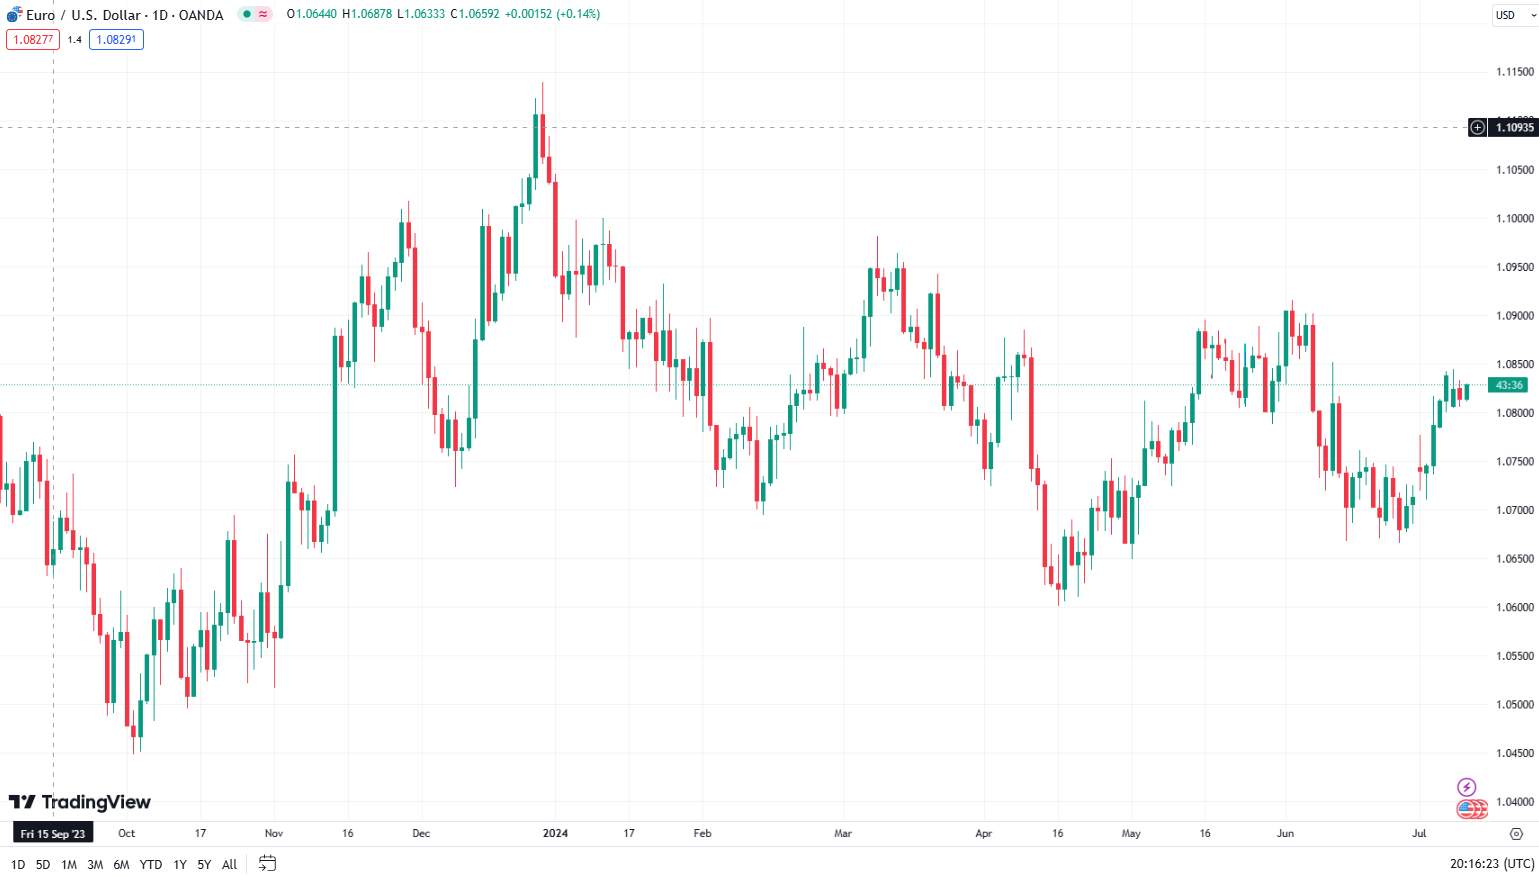
Candlestick charts
Candlestick charts are a popular tool for Forex trading because they provide a detailed view of price movements. Each candlestick represents a specific time period and displays the opening, closing, high, and low prices. The body of the candlestick shows the price range between the open and close, with different colors indicating whether the price increased (bullish) or decreased (bearish). The wicks, or shadows, indicate the highest and lowest prices during the time period. This visual representation helps traders quickly identify market trends, patterns, and potential reversals, making it easier to make informed trading decisions.
- Pros
- Cons
- Visual information: They use color and size to show the difference between opening and closing prices, allowing traders to quickly grasp price movement direction.
- Trend and pattern identification: Easier to identify trends and patterns due to the detailed information provided by candles.
- Noise filtering: Candlestick charts account for all price information, helping to filter out noise from small price fluctuations.
- Complexity: Candlestick charts can be more difficult to understand due to the additional information and visual clutter.
- Susceptible to noise: They can still be affected by noise from small price fluctuations, making trend identification challenging.
Additional charts
Additional charts
Additional charts are vital for giving traders a broader view of market trends and price movements. They provide various perspectives on currency pairs, helping traders spot patterns and opportunities that might not be evident in a single chart. By utilizing different time frames or technical indicators, traders can make more informed decisions, better manage risks, and improve their trading strategies. These extra charts are crucial for both short-term and long-term trading, offering insights that enhance market analysis and decision-making.
Additional charts:
Renko charts
Heiken Ashi charts
Tick charts
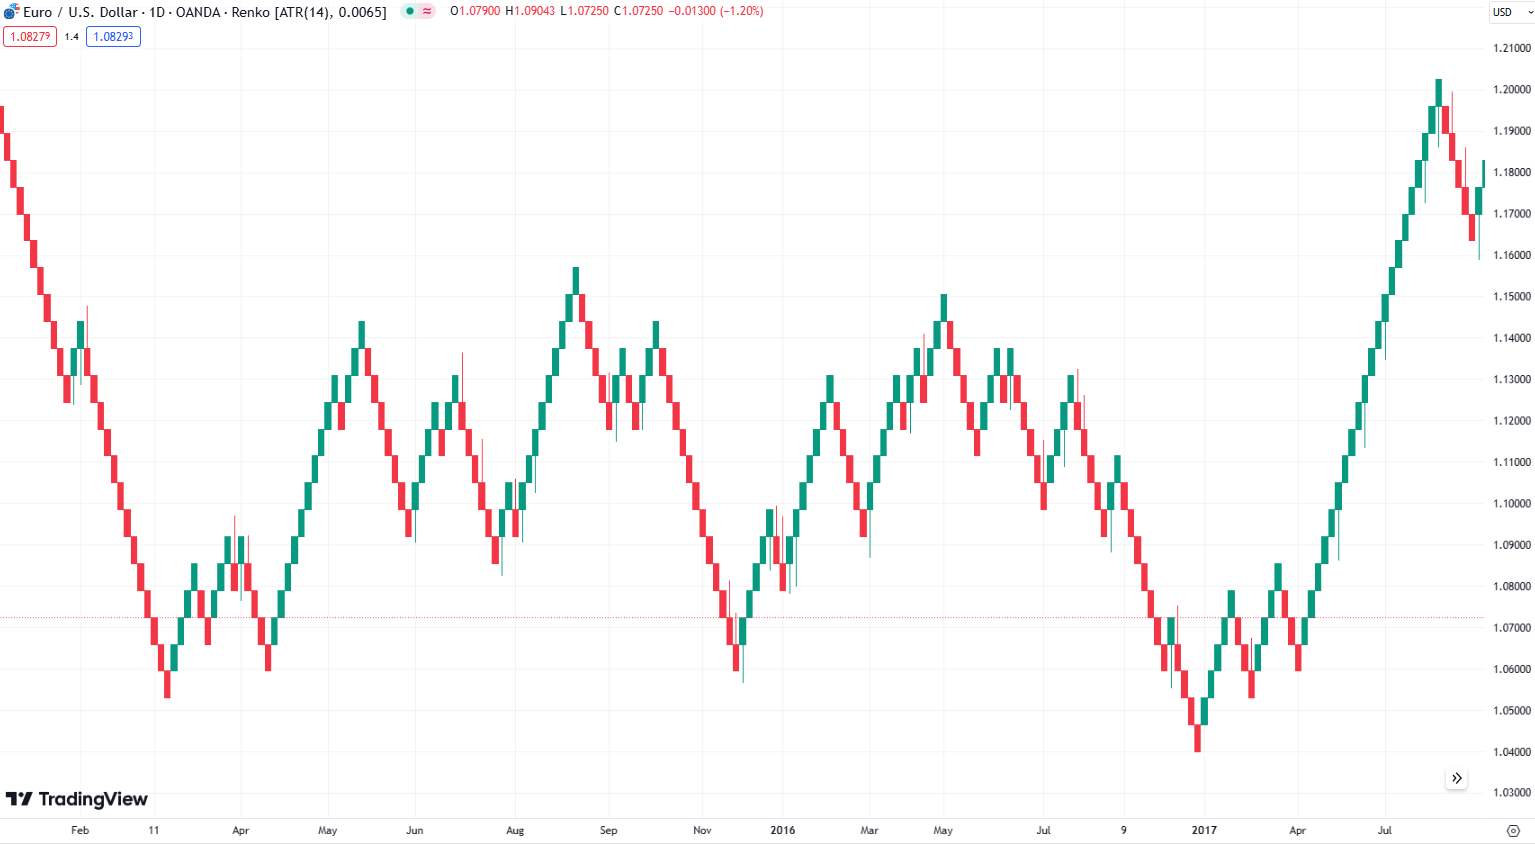
Renko Charts
Renko charts focus on price movement rather than time intervals, providing a clearer view of trends by using bricks to represent price changes.
- Pros
- Cons
- Noise reduction: Renko charts filter out minor price fluctuations, making it easier to identify significant trends.
- Clear trends: They provide a clear and straightforward view of market trends, helping traders spot trend reversals and continuations.
- Simplicity: Renko charts are easy to read and understand, especially for identifying support and resistance levels.
- Lagging information: Because they are based on price movement, Renko charts can lag behind real-time data.
- Lack of detail: They do not show precise price points for each time period, which can omit important market information.
- Customization required: The brick size needs to be adjusted appropriately for different assets and timeframes, which can be challenging for beginners.
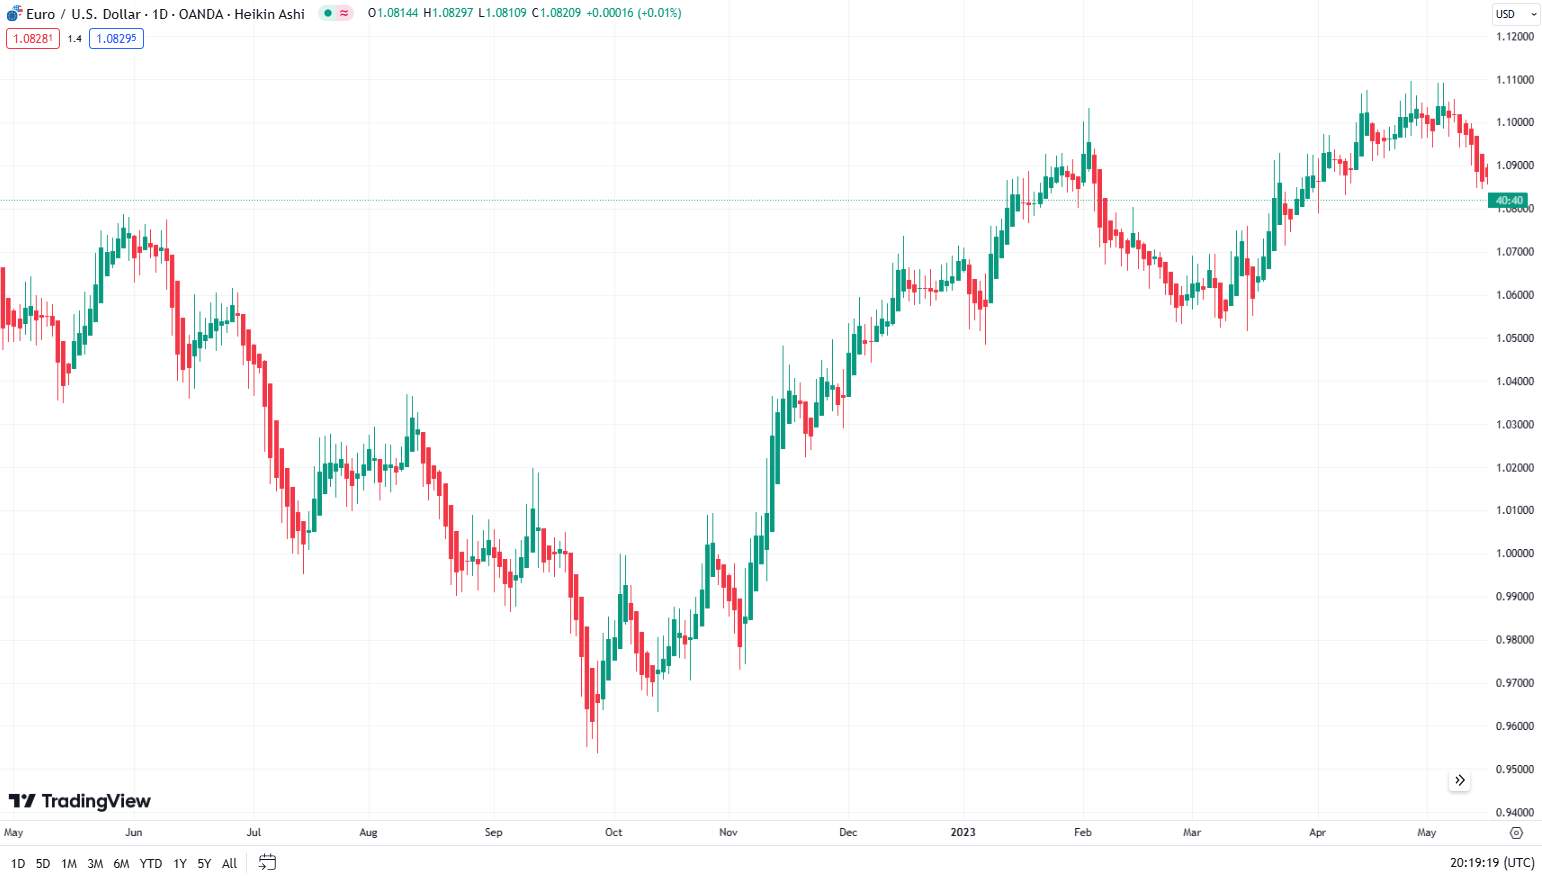
Heiken Ashi charts
Heiken Ashi charts smooth out price data to better identify trends, using average values to create candlesticks that minimize noise.
- Pros
- Cons
- Trend clarity: Heiken Ashi charts provide a smoother representation of price trends, making it easier to identify trend direction and strength.
- Reduced noise: By averaging price data, these charts reduce the impact of minor price fluctuations.
- Easy to interpret: The visual simplicity of Heiken Ashi charts makes them accessible to traders of all experience levels.
- Lagging information: The smoothing effect can cause a delay in reflecting real-time price changes.
- Less precise: They do not show exact opening and closing prices for each period, which can be crucial for certain trading strategies.
- Not suitable for all strategies: Heiken Ashi charts may not be ideal for short-term or scalping strategies due to their lagging nature.
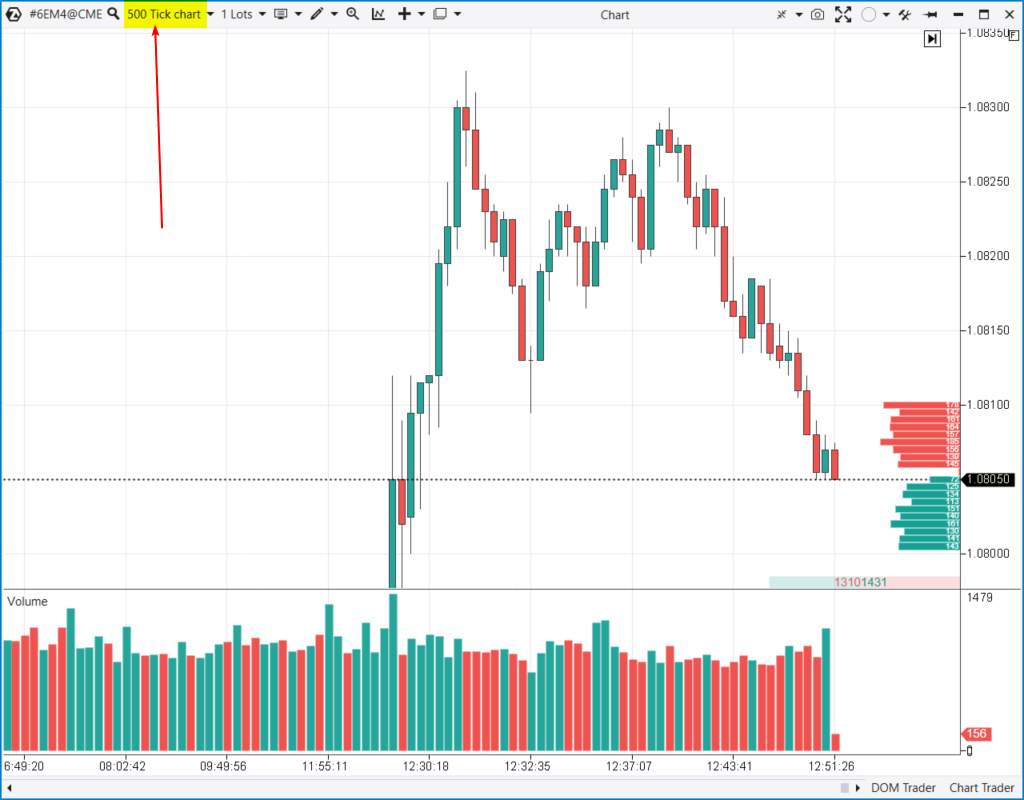
Tick charts
Tick charts display price movements based on a set number of transactions (ticks) rather than fixed time intervals, providing a more dynamic view of market activity.
- Pros
- Cons
- Market activity insight: Tick charts show price changes based on transaction volume, offering a real-time view of market activity.
- Noise reduction: By focusing on transaction volume, tick charts can filter out periods of low activity and highlight significant price movements.
- Scalping suitability: They are ideal for scalping and short-term trading strategies, where quick decision-making is crucial.
- Complexity: Tick charts can be more complex to set up and interpret, particularly for beginners.
- Volatility sensitivity: They can be highly sensitive to market volatility, leading to rapid chart changes during high-activity periods.
- Data dependency: The effectiveness of tick charts relies on the availability and accuracy of transaction data, which can vary between brokers and platforms.
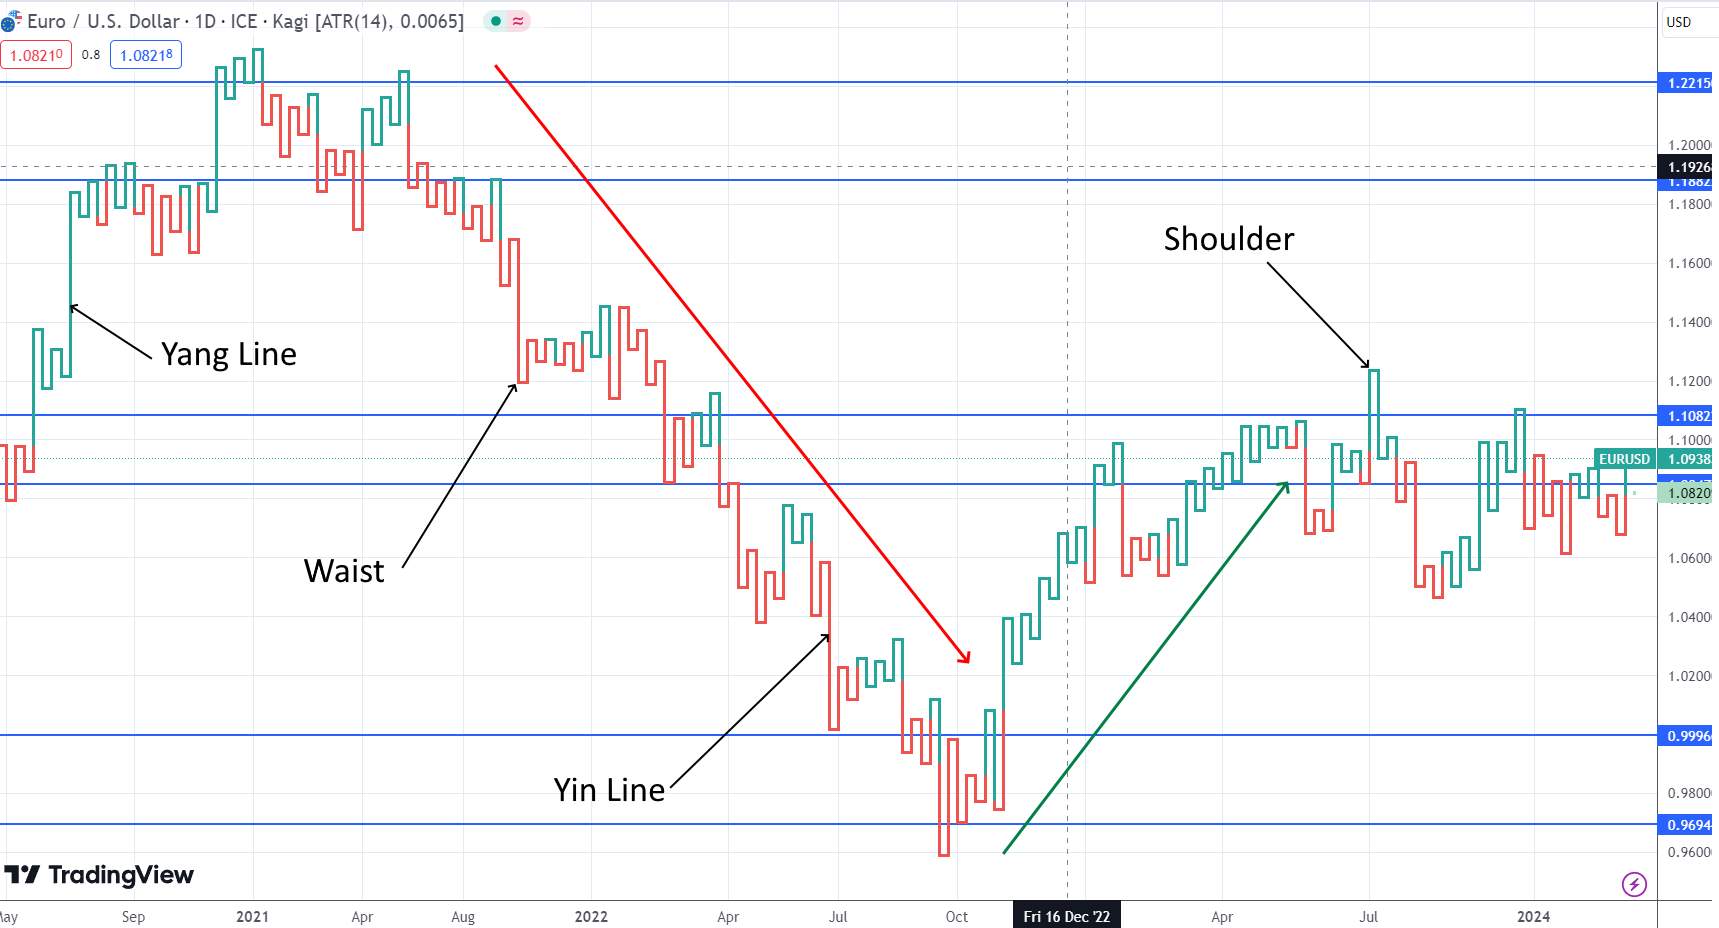
Kagi charts
All lines on the exotic Kagi chart are divided into 2 types - thick and thin: growth lines "Yang" (green) and decline periods "Yin" (red), and the transitions between them are horizontal "Shoulder/Thigh" sections and connect the growth line with the decline line or vice versa. For a new direction to appear on Kagi, the market movement should be quite significant (about 5% of the current price or 5-8 ATR) - and then it is always worth paying attention to it.
- Pros
- Cons
- Clear trend: the angle of the line gives a strong signal about the validity of the trend.
- Filters market noise: removes localized movements and sees global direction.
- Visualization: of pivot points and support/resistance zones.
- Unsuitable for short-term deals: does not use timing indicators and suffers from lag.
- Difficult to set up: wrong choice of reversal parameter leads to false interpretation of data.
- Limited use: not suitable for volatile assets and assets with large gaps.
How to choose a chart
Choosing the right Forex trading chart depends on your goals, experience, and preferred analysis methods. Here are some tips to help you decide:
Know your trading style: If you're a day trader or scalper, use 1-minute or 5-minute charts. For swing trading or long-term investing, daily or weekly charts are better.
Explore chart types: Learn about line, bar, candlestick, Heikin-Ashi, Renko, and Point and Figure charts. Candlestick charts give detailed price info, while Heikin-Ashi charts help you see trends more clearly.
Match your experience: Beginners should start with simple line charts. As you get more experienced, try candlestick or Renko charts for more detailed market insights.
Align with your analysis method: Pick charts that match your analysis style. Candlestick charts are great for spotting patterns, while Point and Figure charts highlight support and resistance without focusing on time.
Experiment with charts: Use demo accounts to try different chart types and time frames. This hands-on approach will help you find the best charts for your trading style.
We've analyzed several brokers to help you get started on your trading journey, and each offers a demo account. Here are their primary conditions:
| Demo | Min. deposit, $ | Max. leverage | Min Spread EUR/USD, pips | Max Spread EUR/USD, pips | Open account | |
|---|---|---|---|---|---|---|
| Yes | 100 | 1:300 | 0,5 | 0,9 | Open an account Your capital is at risk. |
|
| Yes | No | 1:500 | 0,5 | 1,5 | Open an account Your capital is at risk.
|
|
| Yes | No | 1:200 | 0,1 | 0,5 | Open an account Your capital is at risk. |
|
| Yes | 100 | 1:50 | 0,7 | 1,2 | Study review | |
| Yes | No | 1:30 | 0,2 | 0,8 | Open an account Your capital is at risk. |
How to read charts in Forex
Reading charts in Forex involves understanding the various components and interpreting the data to make informed trading decisions. Here's a step-by-step guide:
Understanding the basic components
Time frame: Charts can display data over different periods, from minutes to years. The time frame you choose depends on your trading style. Shorter time frames are for day trading, while longer ones are for swing trading or long-term investing.
Price axis (Y-Axis): This vertical axis shows the price levels of the currency pair.
Time axis (X-Axis): This horizontal axis represents time intervals based on the selected time frame.
Candlesticks/bars/lines: These represent the price action within the chosen time frame. Each type of chart (line, bar, candlestick) displays this information differently.
Reading candlestick charts
Candlesticks: Each candlestick shows the open, high, low, and close prices for the selected time period.
Body: The rectangle between the opening and closing prices. If the close is higher than the open, the body is typically green or white (bullish); if the close is lower, the body is red or black (bearish).
Wicks (shadows): The lines above and below the body showing the highest and lowest prices during the time period.
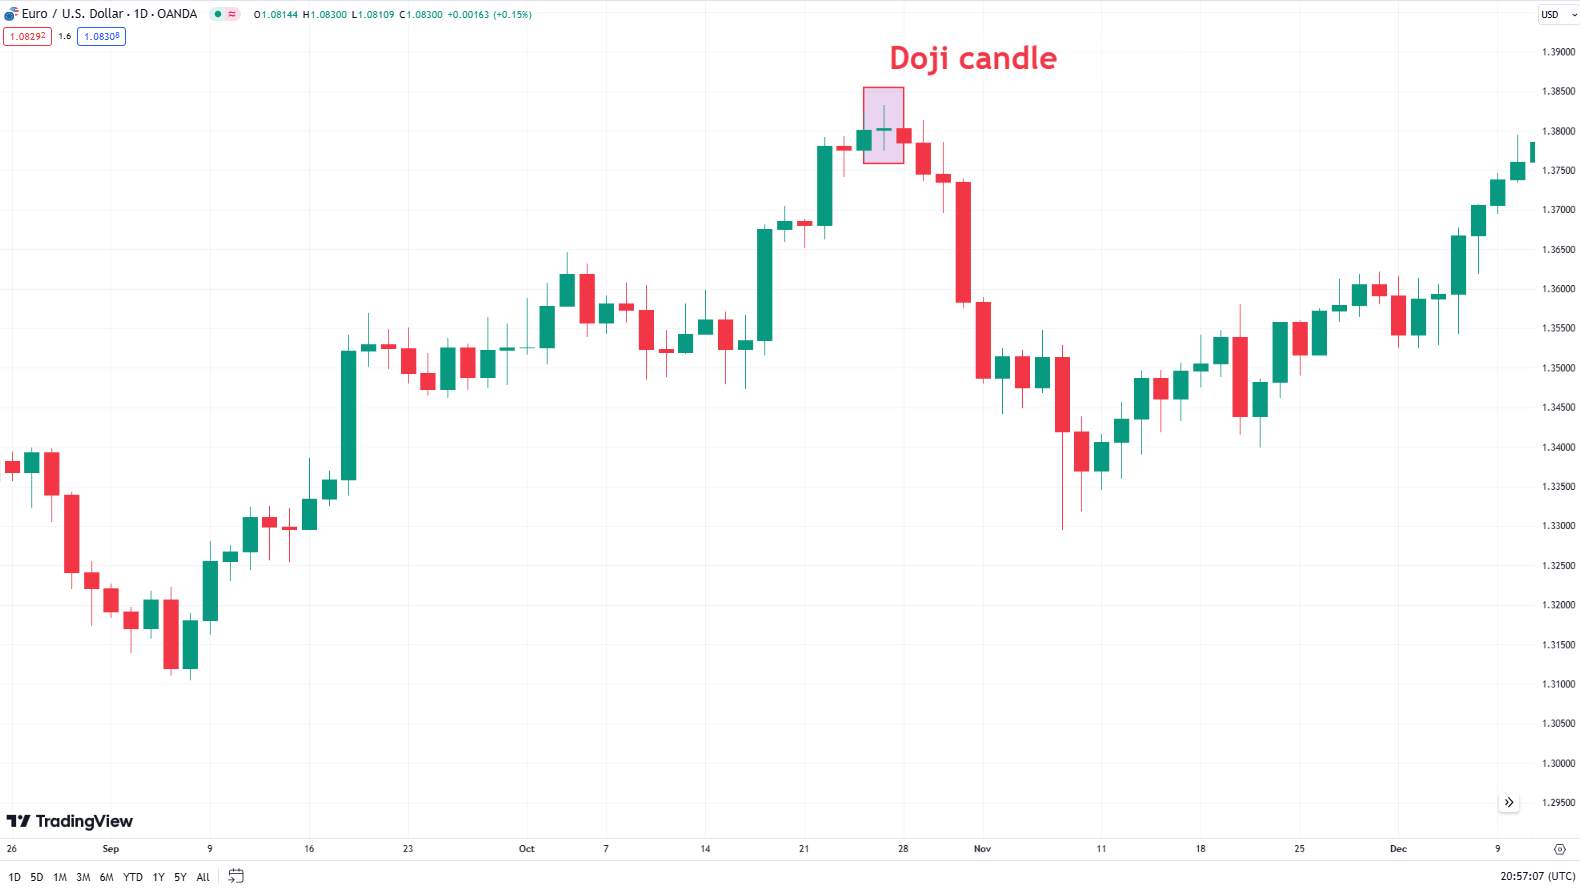
Patterns: Look for common candlestick patterns that can indicate potential market reversals or continuations, such as:
Doji: Shows market indecision, with open and close prices being very close.
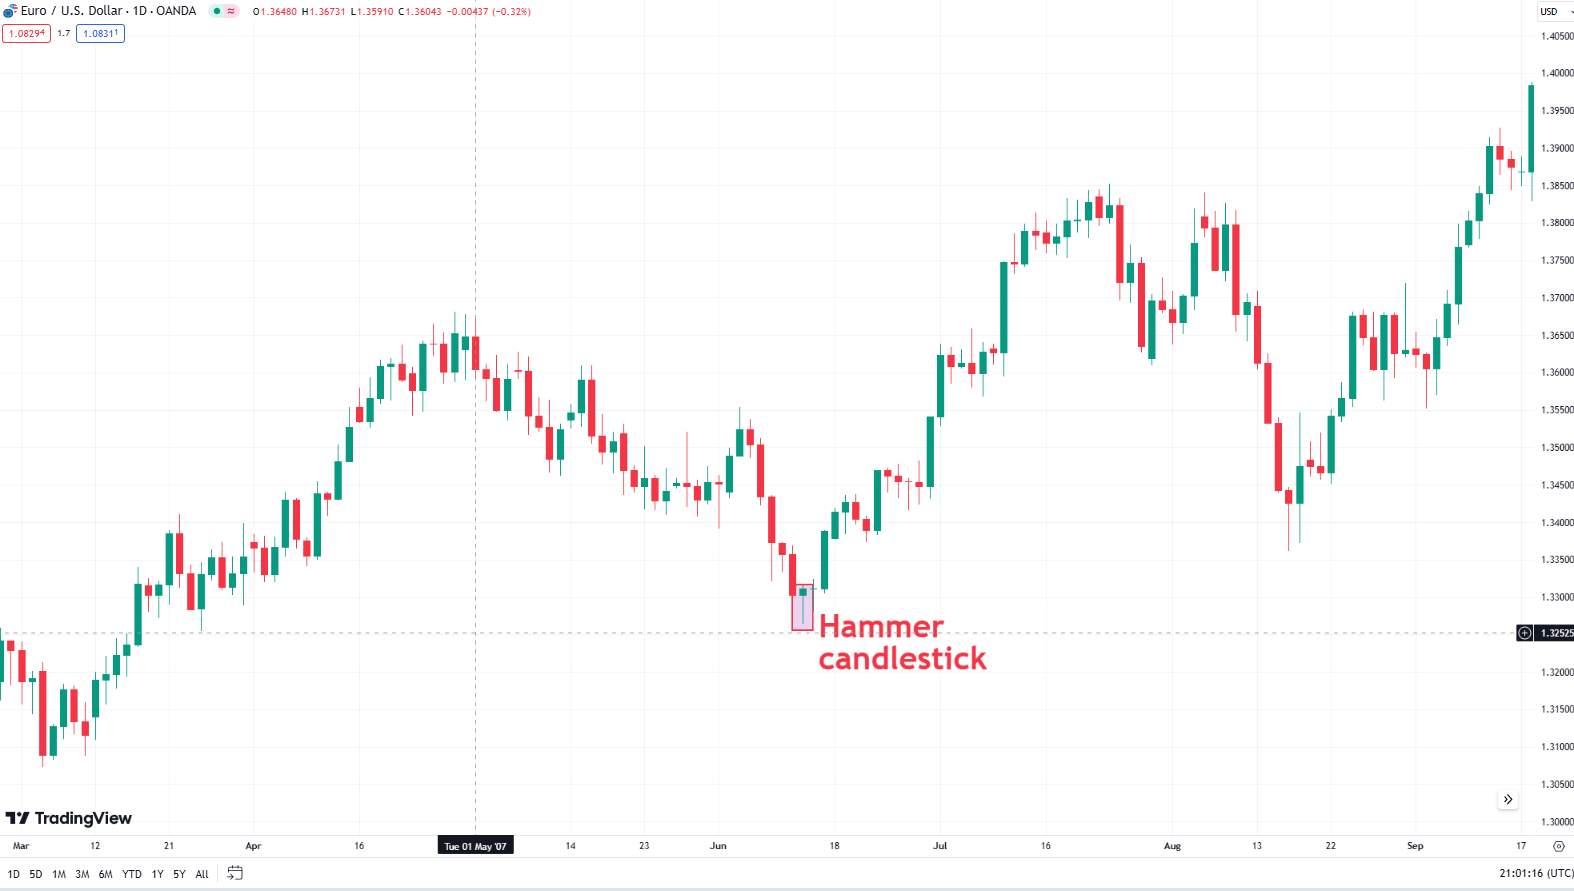
Hammer: Indicates a potential reversal at the bottom of a downtrend, with a small body and long lower wick.
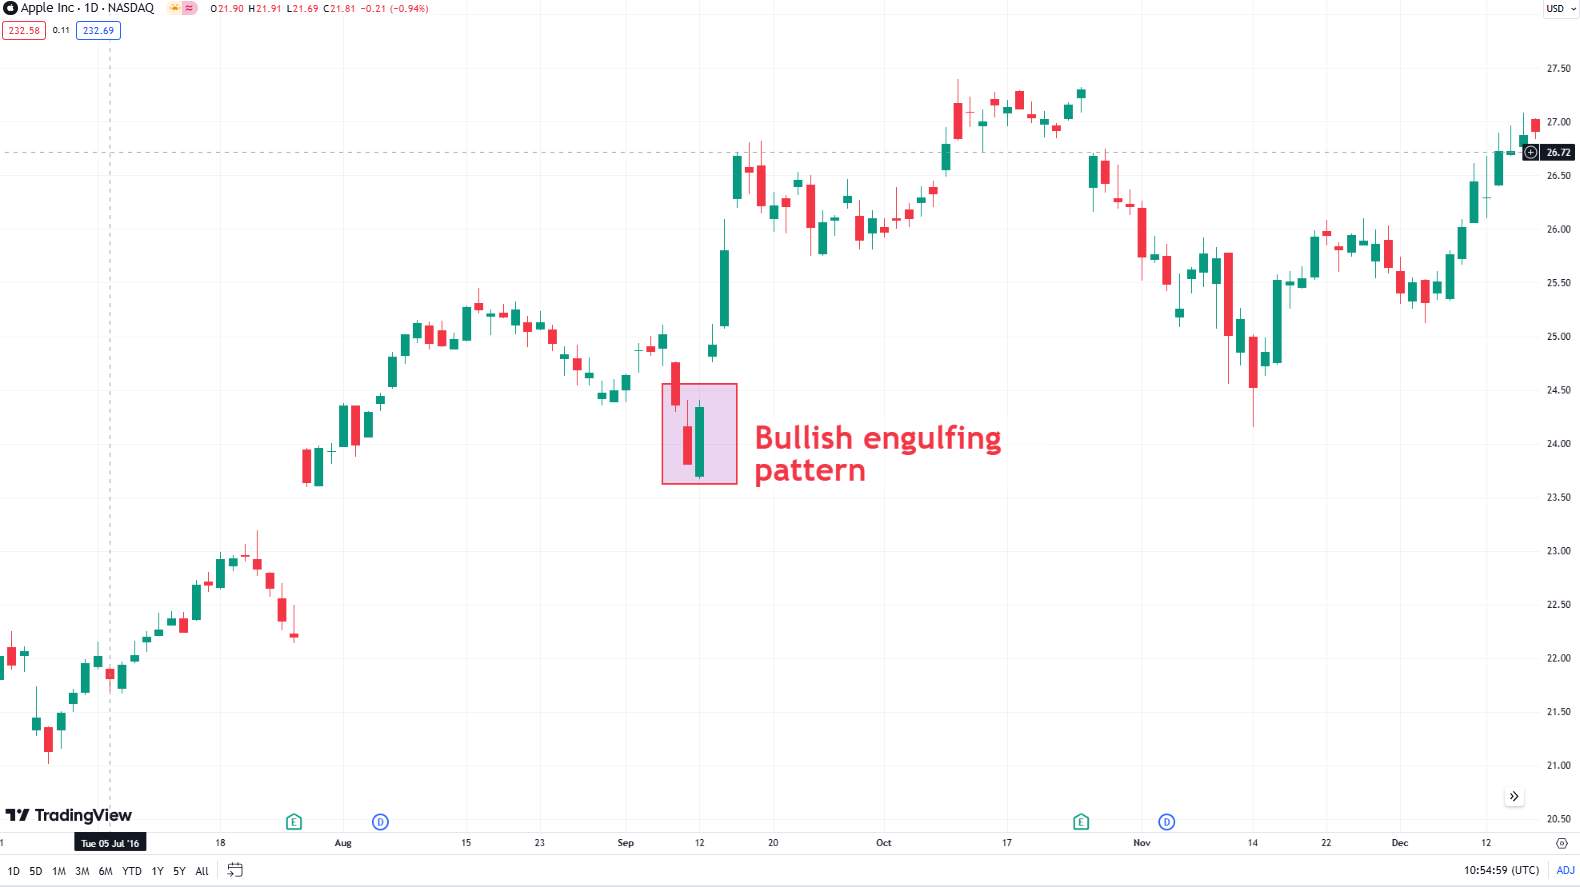
Engulfing: A larger candlestick engulfing the previous one, indicating a potential reversal.
Analyzing trends
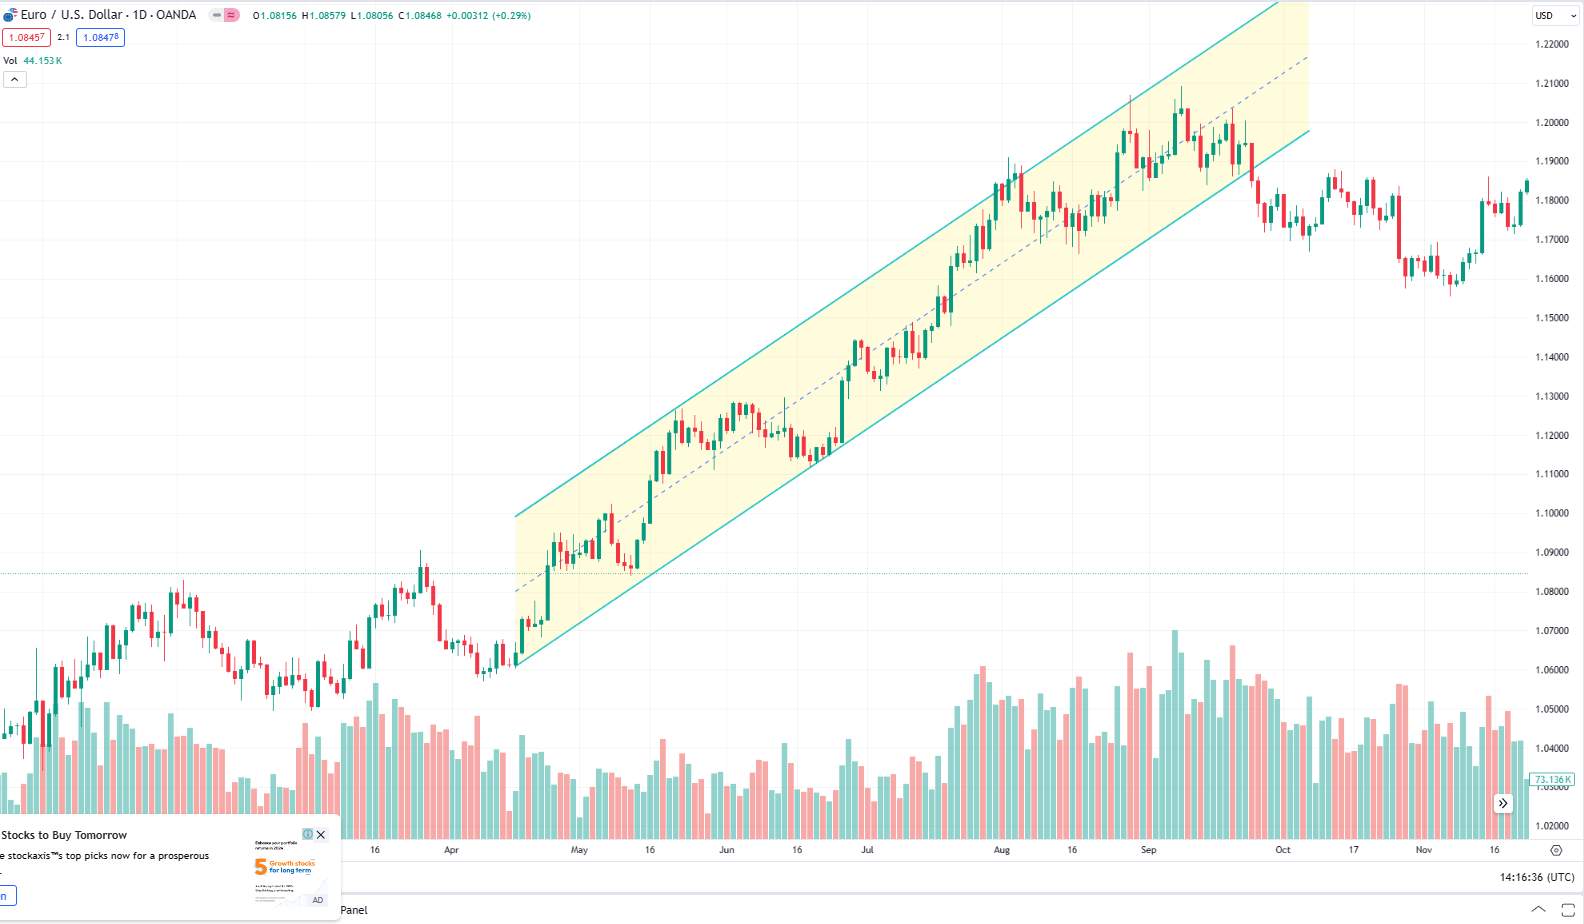
1. Trend lines: Drawn on the chart to connect price points, indicating the general direction of the market (uptrend, downtrend, sideways).
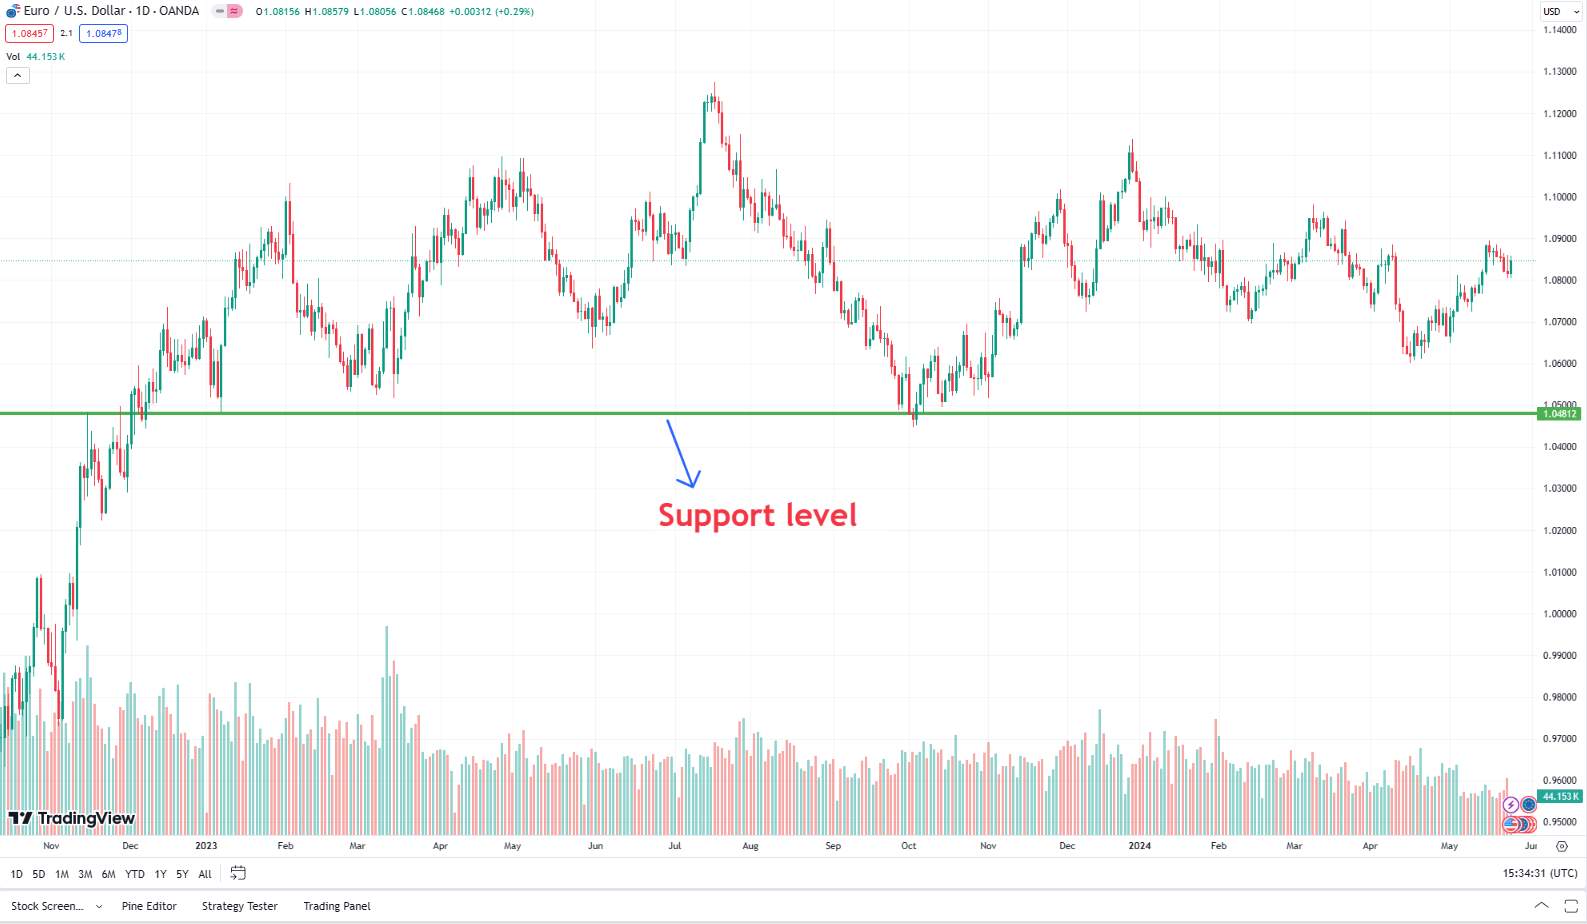
2. Support and resistance: Horizontal lines drawn at price levels where the market has historically had difficulty moving above (resistance) or below (support).
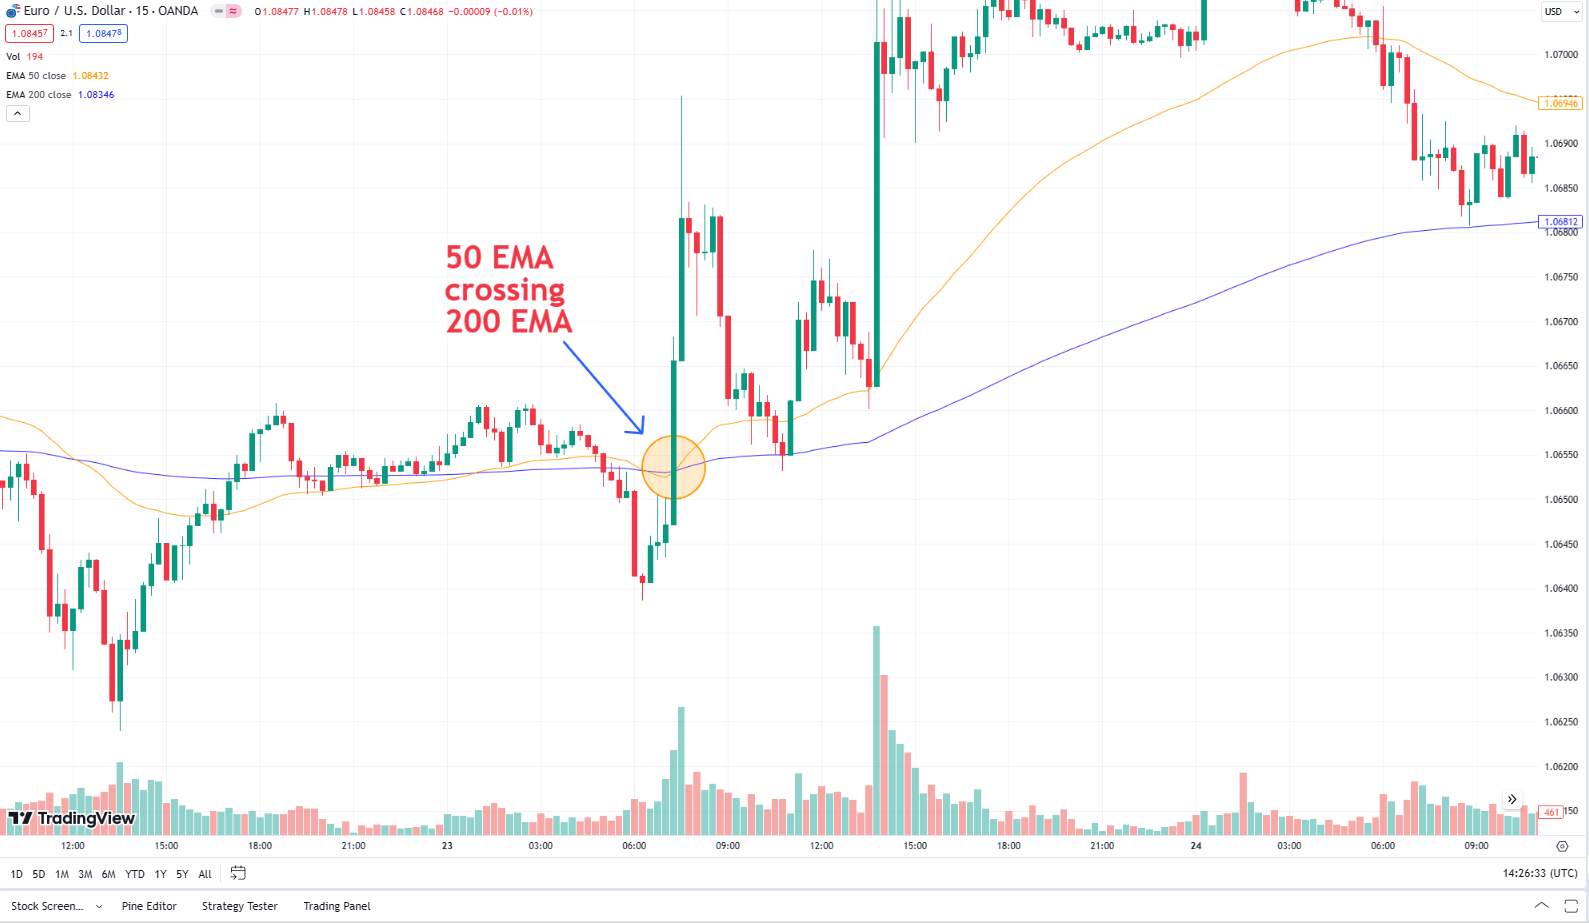
Using technical indicators
1. Moving averages: Smooth out price action to identify trends. Common types include Simple Moving Average (SMA) and Exponential Moving Average (EMA).
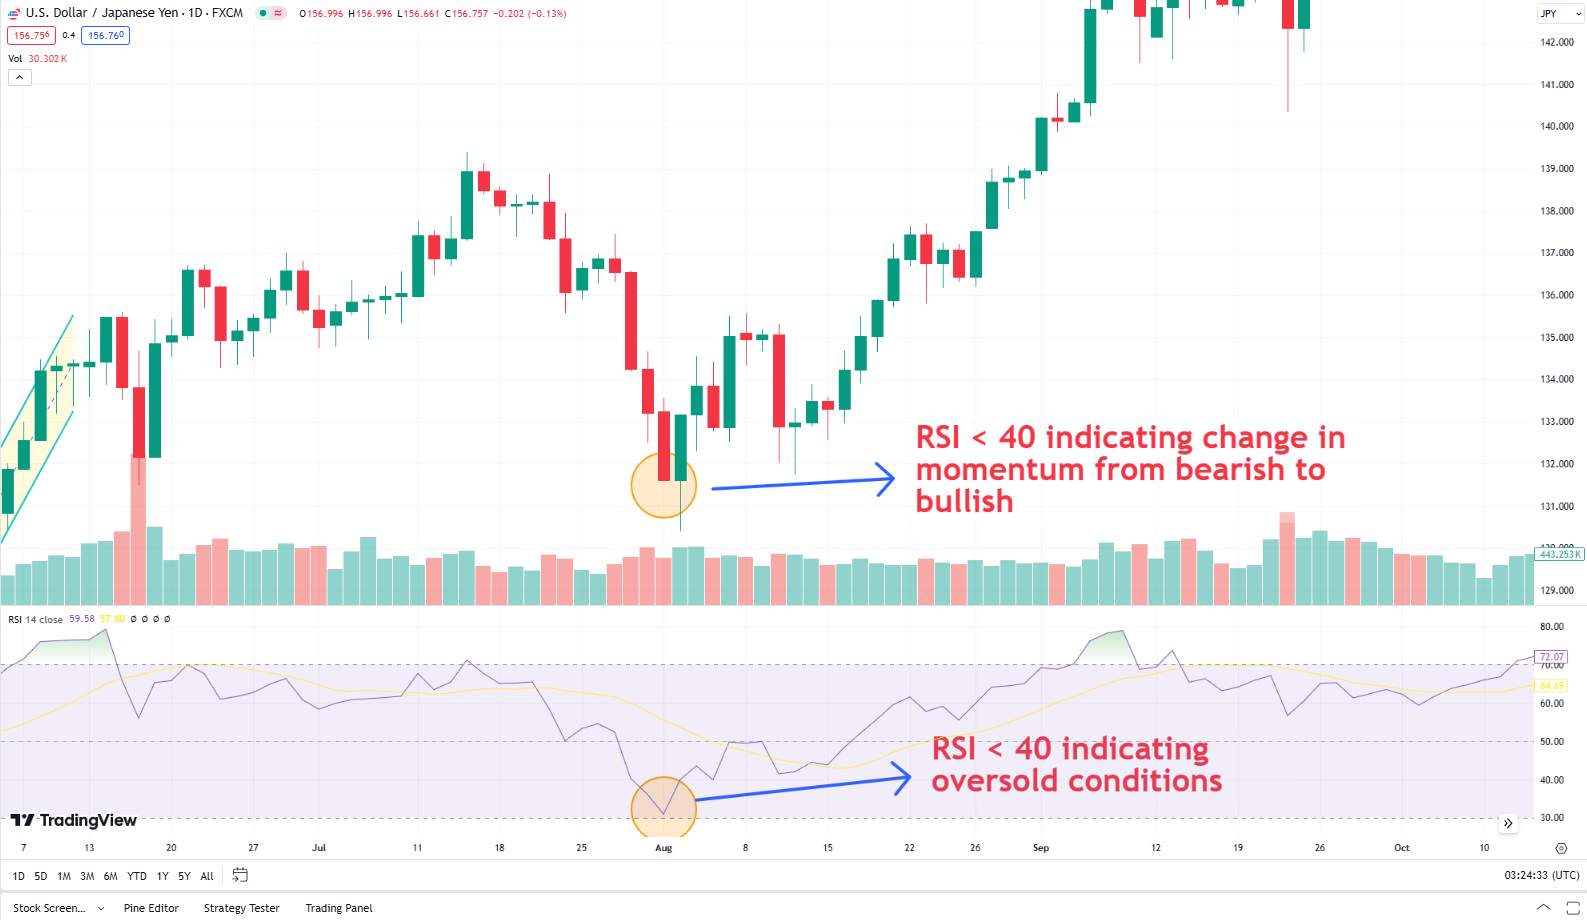
2. Relative strength index (RSI): Measures the speed and change of price movements to identify overbought or oversold conditions.
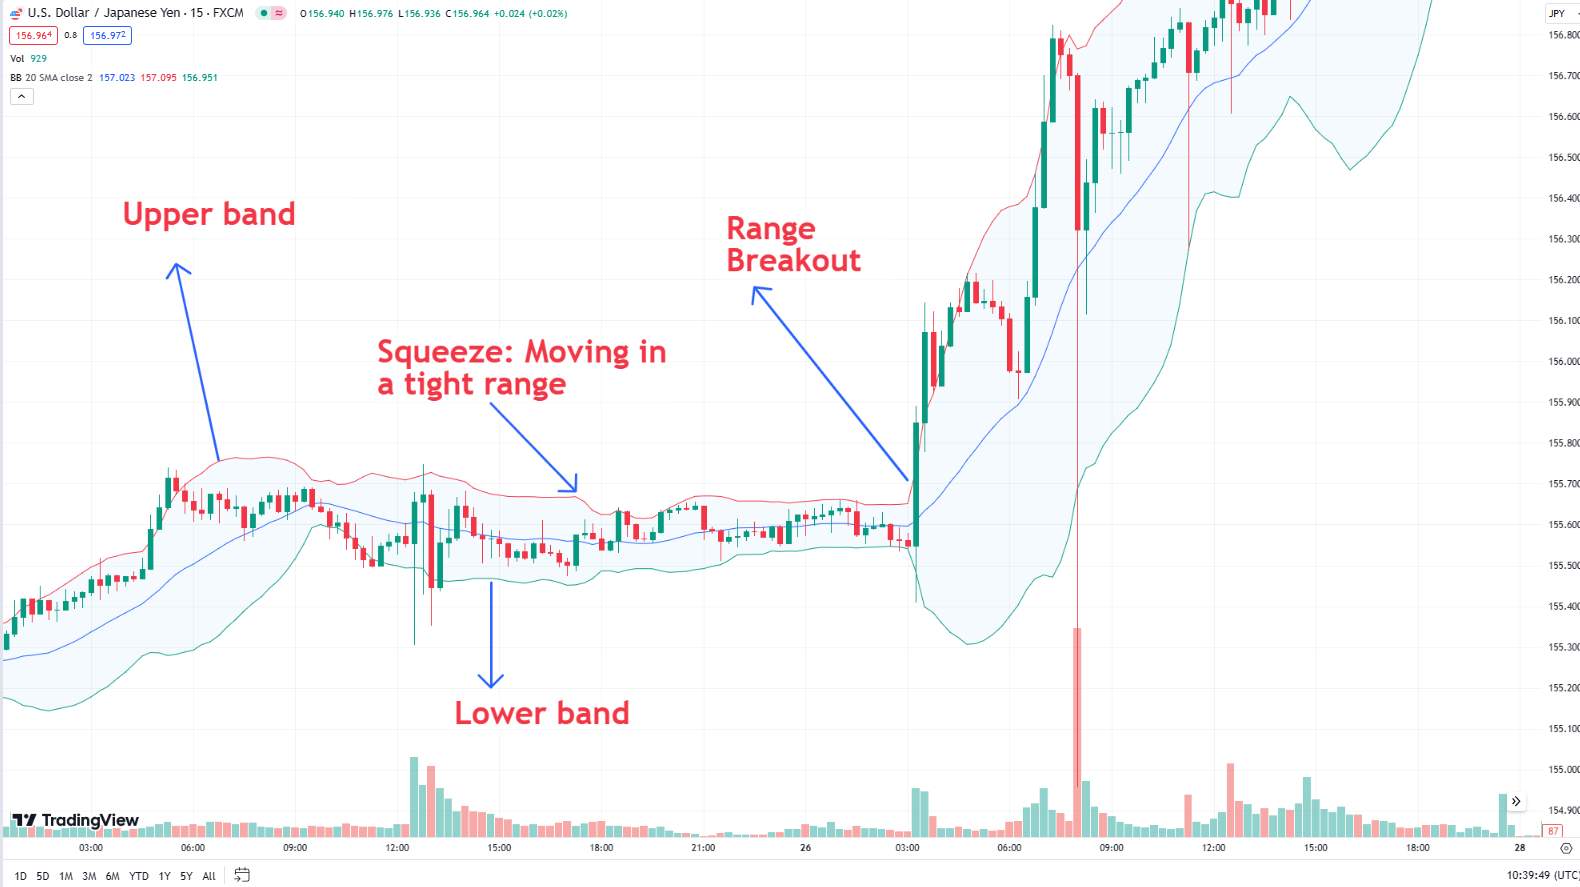
3. Bollinger bands: Indicate volatility and potential price reversals by plotting bands around a moving average.
Practice and application
Practice: Use demo accounts to practice reading and interpreting charts without risking real money.
Stay updated: Continuously learn and stay updated on new charting techniques and tools to refine your skills.
Charts as an illustration of your decision

I rely heavily on charts to make informed decisions. Charts are indispensable tools that help me visualize market trends, identify trading opportunities, and manage risk effectively. They provide a graphical representation of historical price movements, which allows me to analyze past behavior and predict future price action.
I employ various technical indicators and drawing tools. Moving averages, Bollinger Bands, and RSI are some of my go-to indicators. They help me confirm trends, gauge market volatility, and identify overbought or oversold conditions. Drawing tools like trend lines and Fibonacci retracement levels aid in pinpointing potential support and resistance areas.
Charts are the backbone of my Forex trading strategy. They provide the visual and analytical foundation needed to navigate the complexities of the currency markets. By mastering the art of chart analysis, I can make more informed trading decisions, manage risks effectively, and ultimately enhance my trading performance.
Summary
Charts in Forex trading are crucial for understanding price history and forecasting trends. There are three main chart types: candlestick, line, and bar charts. Candlestick charts help traders see market sentiment and spot possible price changes with patterns like doji and engulfing. Line charts show long-term trends by connecting closing prices, while bar charts give detailed data on opening, closing, highs, and lows.
Traders use tools like moving averages, Bollinger Bands, and RSI, along with trend lines and Fibonacci retracements, to improve their analysis. Looking at different time frames helps match trading strategies with market trends and find the best entry and exit points. Overall, charts are essential for making smart trades, managing risks, and boosting performance in Forex trading.
FAQs
What are the most important forex charts?
Daily and weekly candlestick charts are crucial for forex trading. They offer a comprehensive view of price movements, helping traders identify trends, potential reversals, and key support and resistance levels.
What are the different types of charts in MT4?
MT4 provides several chart types, including line charts, bar charts, candlestick charts, Heikin-Ashi charts, Renko charts, and Point and Figure charts. Among these, candlestick charts are the most widely used by forex traders due to the detailed information they convey about price action.
What are the different types of forex charts?
The primary types of forex charts are line charts, bar charts, and candlestick charts. Candlestick charts are the most popular because they offer the most comprehensive insights into price movements.
Which price chart is best for beginners?
For beginners, the line chart is ideal. It is straightforward to understand, highlights closing prices, and is useful for identifying long-term trends.
Related Articles
Team that worked on the article
Parshwa is a content expert and finance professional possessing deep knowledge of stock and options trading, technical and fundamental analysis, and equity research. As a Chartered Accountant Finalist, Parshwa also has expertise in Forex, crypto trading, and personal taxation. His experience is showcased by a prolific body of over 100 articles on Forex, crypto, equity, and personal finance, alongside personalized advisory roles in tax consultation.
Chinmay Soni is a financial analyst with more than 5 years of experience in working with stocks, Forex, derivatives, and other assets. As a founder of a boutique research firm and an active researcher, he covers various industries and fields, providing insights backed by statistical data. He is also an educator in the field of finance and technology.
As an author for Traders Union, he contributes his deep analytical insights on various topics, taking into account various aspects.
Mirjan Hipolito is a journalist and news editor at Traders Union. She is an expert crypto writer with five years of experience in the financial markets. Her specialties are daily market news, price predictions, and Initial Coin Offerings (ICO).
Forex trading, short for foreign exchange trading, is the practice of buying and selling currencies in the global foreign exchange market with the aim of profiting from fluctuations in exchange rates. Traders speculate on whether one currency will rise or fall in value relative to another currency and make trading decisions accordingly. However, beware that trading carries risks, and you can lose your whole capital.
In the Forex market, a “trend” is the label used to describe the general direction that the prices of currency pairs are moving in, over a specific period of time. Trends are basically the pattern that a currency pair appears to be following and can help traders determine when to enter and exit a trade.
Day trading involves buying and selling financial assets within the same trading day, with the goal of profiting from short-term price fluctuations, and positions are typically not held overnight.
Index in trading is the measure of the performance of a group of stocks, which can include the assets and securities in it.
Volatility refers to the degree of variation or fluctuation in the price or value of a financial asset, such as stocks, bonds, or cryptocurrencies, over a period of time. Higher volatility indicates that an asset's price is experiencing more significant and rapid price swings, while lower volatility suggests relatively stable and gradual price movements.

-
 Afghanistan
-
 Albania
-
 Algeria
-
 Argentina
-
 Armenia
-
 Australia
-
 Austria
-
 Azerbaijan
-
 Bahamas
-
 Bahrain
-
 Bangladesh
-
 Belgium
-
 Botswana
-
 Brazil
-
 Brunei
-
 Bulgaria
-
 Burma
Burma
-
 Cambodia
-
 Cameroon
-
 Canada
-
 Chile
Chile
-
 China
China
-
 Colombia
-
 Costa Rica
-
 Cote d'Ivoire
-
 Croatia
-
 Cyprus
-
 Czech Republic
-
 Denmark
-
 Dominican Republic
-
 Ecuador
-
 Egypt
Egypt
-
 Estonia
-
 Eswatini
-
 Ethiopia
-
 Finland
-
 France
-
 Georgia
-
 Germany
-
 Ghana
Ghana
-
 Greece
-
 Haiti
Haiti
-
 Hong Kong
-
 Hungary
-
 India
India
-
 Indonesia
-
 Iran, Islamic republic
-
 Iraq
Iraq
-
 Ireland
-
 Israel
-
 Italy
Italy
-
 Jamaica
-
 Japan
Japan
-
 Jordan
-
 Kazakhstan
-
 Kenya
Kenya
-
 Korea
Korea
-
 Kuwait
-
 Kyrgyzstan
-
 Laos
Laos
-
 Latvia
-
 Lebanon
-
 Libyan Arab Jamahiriya
-
 Lithuania
-
 Luxembourg
-
 Macedonia
-
 Madagascar
-
 Malaysia
-
 Malta
Malta
-
 Mauritius
-
 Mexico
-
 Moldova
-
 Mongolia
-
 Montenegro
-
 Morocco
-
 Mozambique
-
 Namibia
-
 Nepal
Nepal
-
 Netherlands
-
 Nigeria
-
 Norway
-
 Oman
Oman
-
 Pakistan
-
 Palestine
-
 Papua New Guinea
-
 Peru
Peru
-
 Philippines
-
 Poland
-
 Portugal
-
 Puerto Rico
-
 Qatar
Qatar
-
 Romania
-
 Rwanda
-
 Saudi Arabia
-
 Serbia
-
 Singapore
-
 Slovakia
-
 Slovenia
-
 Somalia
-
 South Africa
-
 Spain
Spain
-
 Sri Lanka
-
 Sweden
-
 Switzerland
-
 Syrian Arab Republic
-
 Taiwan
-
 Tajikistan
-
 Tanzania, United Republic Of
-
 Thailand
-
 Trinidad and Tobago
-
 Tunisia
-
 Turkey
-
 UAE
UAE
-
 Uganda
-
 Ukraine
-
 United Kingdom
-
United States
-
 Uzbekistan
-
 Venezuela
-
 Vietnam
-
 Yemen
Yemen
-
 Zambia
-
 Zimbabwe
- Forex
- Crypto

