

Why is Applied Materials stock down today? Support test at $490.45 and downside targets

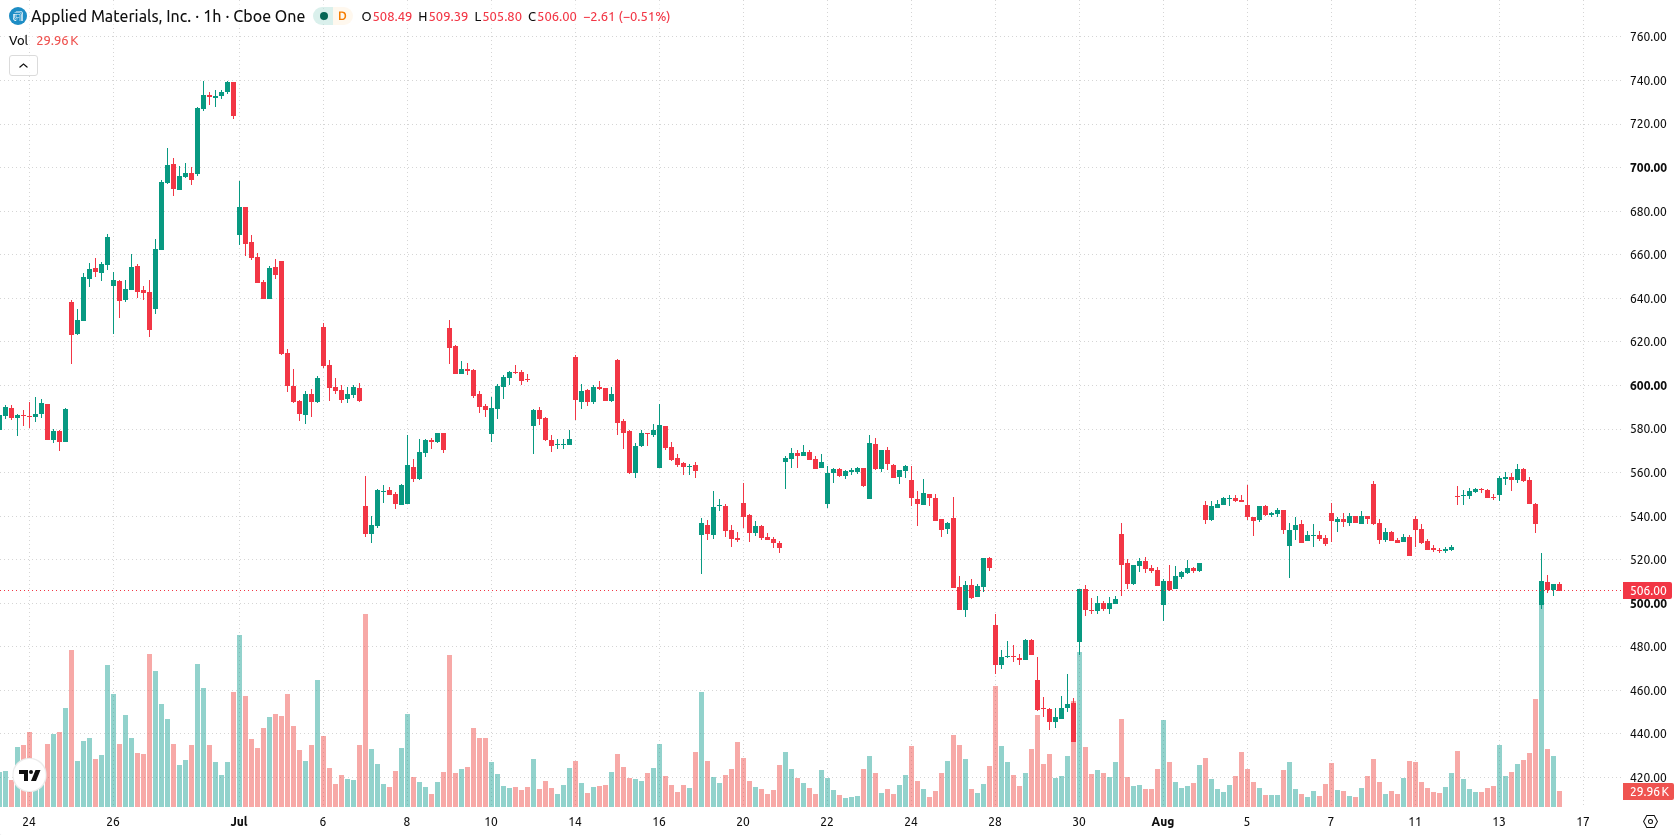
Applied Materials (AMAT) stock is trading at $509.32 after a decline of 4.72% on the day, registering a sharp drop. The price now sits below its key moving averages, reflecting notable short- and medium-term weakness.
 404.18
426.39
Highlights
- Applied Materials reported record third quarter 2026 revenue of $9.12 billion, up 25% year over year, with strong customer demand.
- GAAP EPS reached $3.17 and non-GAAP EPS set a new high at $3.50, up 41% over last year, as the company raised gross margin above 50% and returned $860 million to shareholders.
- Shares of Applied Materials dropped 4.72% and trade below key short-term averages as momentum and oscillator signals indicate persistent downside, with a projected range of $490.45 to $528.19 over the next 2 to 3 trading days.
Operations and demand drive record gains despite equity selling pressure
Applied Materials posted record third quarter 2026 revenue of $9.12 billion, marking a 25% year-over-year increase and confirming robust customer demand, according to Manilatimes. Quarterly profitability also surged, with GAAP EPS reaching $3.17 and record non-GAAP EPS of $3.50, up 41% over the prior year, reflecting operational strength. The company documented a gross margin of over 50% and further expanded its R&D footprint with 11 EPIC Center partnerships, alongside returning $860 million to shareholders through buybacks and dividends as reported by Benzinga — though price action has remained under broader selling pressure.
Momentum weakens as selling dominates below technical resistance
AMAT is trading below its MA-20 at $541.7 and MA-50 at $537.1, while staying above the long-term MA-200 at $387. Price faces resistance at the Ichimoku Kijun level of $532.38. The recent range features a sharp gap of $33.53, with intraday volatility remaining high. Momentum signals are negative, as ADX shows a Sell, MACD is Neutral, and RSI sits at 30.28. Stochastic RSI, CCI, and Bull/Bear Power indicate oversold conditions and dominant selling, with the Awesome Oscillator aligning on the sell side.
Downside risk prevails as consolidation expected in volatility band
Over the next 2 to 3 trading days, AMAT is anticipated to fluctuate between $490.45 and $528.19, reflecting a typical volatility band relative to current levels. There is a 25% probability for an upward move, while the likelihood of further downside is estimated at 75%. The central scenario is for price to consolidate within this corridor, with a bullish break requiring sustained action above $532.38. If support at $490.45 fails, further weakness could be exposed.
Earlier, analysts noted that Applied Materials was displaying bullish technical patterns supported by sector momentum and expanding research partnerships, particularly ahead of earnings. The current breakdown below key moving averages and emergence of oversold conditions reflect a shift in the technical landscape, with traders advised to closely monitor support at $490.45 as the critical level for near-term downside risk.






Latest Applied Materials News




-
 Afghanistan
-
 Albania
-
 Algeria
-
 Angola
-
 Argentina
-
 Armenia
-
 Australia
-
 Austria
-
 Azerbaijan
-
 Bahamas
-
 Bahrain
-
 Bangladesh
-
 Belarus
-
 Belgium
-
 Bolivia
-
 Botswana
-
 Brazil
-
 Brunei
-
 Bulgaria
-
 Cambodia
-
 Cameroon
-
 Canada
-
 Chile
-
 China
-
 Colombia
-
 Congo
-
 Costa Rica
-
 Cote d'Ivoire
-
 Croatia
-
 Cuba
-
 Cyprus
-
 Czechia
-
 DR Congo
-
 Denmark
-
 Dominican Republic
-
 Ecuador
-
 Egypt
-
 El Salvador
-
 Estonia
-
 Eswatini
-
 Ethiopia
-
 Finland
-
 France
-
 Georgia
-
 Germany
-
 Ghana
-
 Greece
-
 Haiti
-
 Hong Kong
-
 Hungary
-
 India
-
 Indonesia
-
 Iran, Islamic republic
-
 Iraq
-
 Ireland
-
 Israel
-
 Italy
-
 Jamaica
-
 Japan
-
 Jordan
-
 Kazakhstan
-
 Kenya
-
 Korea
-
 Kuwait
-
 Kyrgyzstan
-
 Laos
-
 Latvia
-
 Lebanon
-
 Lesotho
-
 Libya
-
 Lithuania
-
 Luxembourg
-
 Madagascar
-
 Malaysia
-
 Malta
-
 Mauritius
-
 Mexico
-
 Moldova
-
 Mongolia
-
 Montenegro
-
 Morocco
-
 Mozambique
-
 Myanmar
-
 Namibia
-
 Nepal
-
 Netherlands
-
 New Zealand
-
 Nigeria
-
 North Macedonia
-
 Norway
-
 Oman
-
 Pakistan
-
 Palestine
-
 Panama
-
 Papua New Guinea
-
 Paraguay
-
 Peru
-
 Philippines
-
 Poland
-
 Portugal
-
 Puerto Rico
-
 Qatar
-
 Reunion
-
 Romania
-
 Rwanda
-
 Saudi Arabia
-
 Serbia
-
 Singapore
-
 Slovakia
-
 Slovenia
-
 Somalia
-
 South Africa
-
 Spain
-
 Sri Lanka
-
 Sweden
-
 Switzerland
-
 Syria
-
 Taiwan
-
 Tajikistan
-
 Tanzania
-
 Thailand
-
 Trinidad and Tobago
-
 Tunisia
-
 Turkey
-
 UAE
-
 Uganda
-
 Ukraine
-
 United Kingdom
-
United States
-
 Uruguay
-
 Uzbekistan
-
 Venezuela
-
 Vietnam
-
 Yemen
-
 Zambia
-
 Zimbabwe
- Forex
- Crypto












