
Technical bearishness persists — Sandbox gains 2.2% as price holds near $0.1441

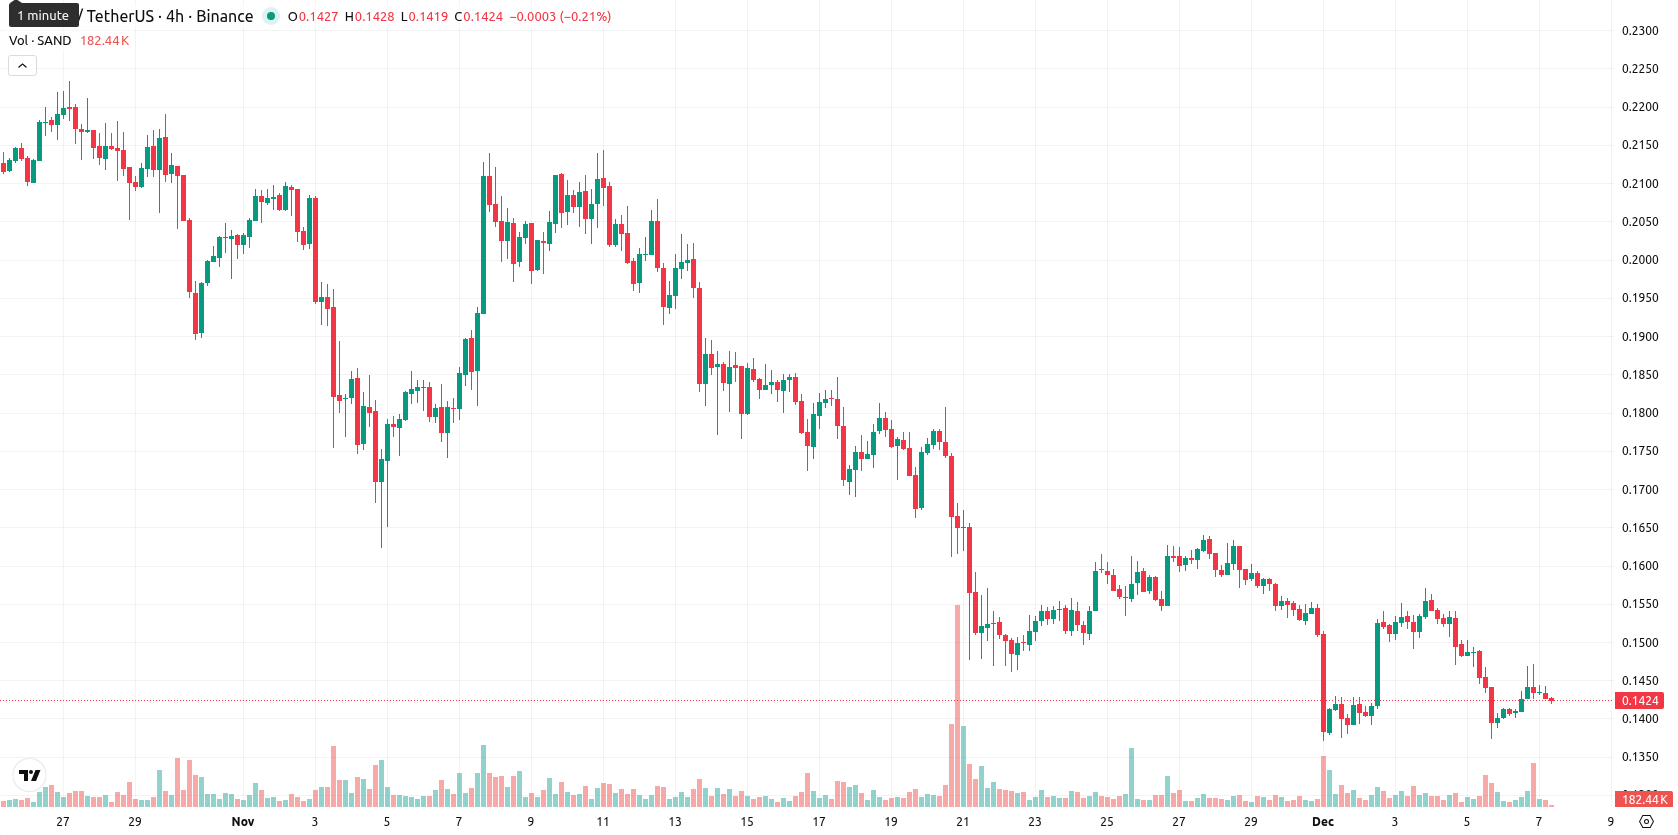
Sandbox (SAND) is trading at $0.1441, posting an intraday gain of 2.2% and moving near today’s high within a narrow range. The asset remains well below key moving averages — the MA-20 at $0.1566, MA-50 at $0.1829, and MA-200 at $0.2548 — underscoring continued selling pressure across all timeframes.
 0.0487
0.0506
0.0487
0.0506
Highlights
- SAND trades at $0.1441, significantly below its MA-20 ($0.1566), MA-50 ($0.1829), and MA-200 ($0.2548), indicating sustained downward pressure.
- Bearish momentum prevails as both MACD (–0.0142) and ADX (above 40) signal sell, with oversold conditions reflected by RSI at 35.29 and CCI at –119.
- Baseline outlook projects SAND to trade sideways between $0.130 and $0.150 over five days, with less than 20% probability of upward breakout.
Seller control persists as momentum and support signals diverge
The technical outlook is bearish for SAND, as the price is below all major moving averages and there is no dynamic support above current levels. The nearest notable resistance stands at the daily Ichimoku Kijun at $0.1757. Daily momentum indicators remain negative with MACD at –0.0142 and ADX above 40, both signaling strong selling strength. However, oscillator signals are mixed: RSI is low at 35.29, CCI is deeply oversold at –119, Stoch RSI provides a mild buy at 57, while BBP is negative and Awesome Oscillator is neutral. This setup highlights persistent dominance by sellers but calls for some caution due to mixed oscillator readings.
Bearish bias prevails as volatility defines short-term range
In the short term, typical volatility is expected to keep SAND in a band between $0.130 and $0.150 over the coming five trading days. The probability of a bullish breakout above this range remains under 20%, while further declines are more likely given persistent bearish momentum and longer-term signals. The base case scenario calls for sideways movement between $0.130 and $0.150, while any sustained weakness below $0.140 could trigger a sharper move toward support near $0.130; a rebound above $0.150 – $0.155 would be needed to shift sentiment toward a move up to $0.175.
Previously it was reported that SAND remained under pressure, trading below major moving averages with daily momentum indicators — including MACD and ADX — maintaining a bearish bias amid heightened intraday volatility. Despite today’s surge and a gap up at the open, there is a divergence between short-term strength and established downtrend signals, with the price currently trading near the top of the session’s range while sellers retain control according to broader trend metrics.


Latest Sandbox News





-
 Afghanistan
-
 Albania
-
 Algeria
-
 Angola
-
 Argentina
-
 Armenia
-
 Australia
-
 Austria
-
 Azerbaijan
-
 Bahamas
-
 Bahrain
-
 Bangladesh
-
 Belarus
-
 Belgium
-
 Bolivia
-
 Botswana
-
 Brazil
-
 Brunei
-
 Bulgaria
-
 Cambodia
-
 Cameroon
-
 Canada
-
 Chile
Chile
-
 China
China
-
 Colombia
-
 Congo
Congo
-
 Costa Rica
-
 Cote d'Ivoire
-
 Croatia
-
 Cuba
Cuba
-
 Cyprus
-
 Czechia
-
 DR Congo
-
 Denmark
-
 Dominican Republic
-
 Ecuador
-
 Egypt
Egypt
-
 El Salvador
-
 Estonia
-
 Eswatini
-
 Ethiopia
-
 Finland
-
 France
-
 Georgia
-
 Germany
-
 Ghana
Ghana
-
 Greece
-
 Haiti
Haiti
-
 Hong Kong
-
 Hungary
-
 India
India
-
 Indonesia
-
 Iran, Islamic republic
-
 Iraq
Iraq
-
 Ireland
-
 Israel
-
 Italy
Italy
-
 Jamaica
-
 Japan
Japan
-
 Jordan
-
 Kazakhstan
-
 Kenya
Kenya
-
 Korea
Korea
-
 Kuwait
-
 Kyrgyzstan
-
 Laos
Laos
-
 Latvia
-
 Lebanon
-
 Lesotho
-
 Libya
Libya
-
 Lithuania
-
 Luxembourg
-
 Madagascar
-
 Malaysia
-
 Malta
Malta
-
 Mauritius
-
 Mexico
-
 Moldova
-
 Mongolia
-
 Montenegro
-
 Morocco
-
 Mozambique
-
 Myanmar
-
 Namibia
-
 Nepal
Nepal
-
 Netherlands
-
 New Zealand
-
 Nigeria
-
 North Macedonia
-
 Norway
-
 Oman
Oman
-
 Pakistan
-
 Palestine
-
 Panama
-
 Papua New Guinea
-
 Paraguay
-
 Peru
Peru
-
 Philippines
-
 Poland
-
 Portugal
-
 Puerto Rico
-
 Qatar
Qatar
-
 Reunion
-
 Romania
-
 Rwanda
-
 Saudi Arabia
-
 Serbia
-
 Singapore
-
 Slovakia
-
 Slovenia
-
 Somalia
-
 South Africa
-
 Spain
Spain
-
 Sri Lanka
-
 Sweden
-
 Switzerland
-
 Syria
Syria
-
 Taiwan
-
 Tajikistan
-
 Tanzania
-
 Thailand
-
 Trinidad and Tobago
-
 Tunisia
-
 Turkey
-
 UAE
UAE
-
 Uganda
-
 Ukraine
-
 United Kingdom
-
United States
-
 Uruguay
-
 Uzbekistan
-
 Venezuela
-
 Vietnam
-
 Yemen
Yemen
-
 Zambia
-
 Zimbabwe
- Forex
- Crypto











