
Starknet price gains 3.11%, after modest recovery from early session lows

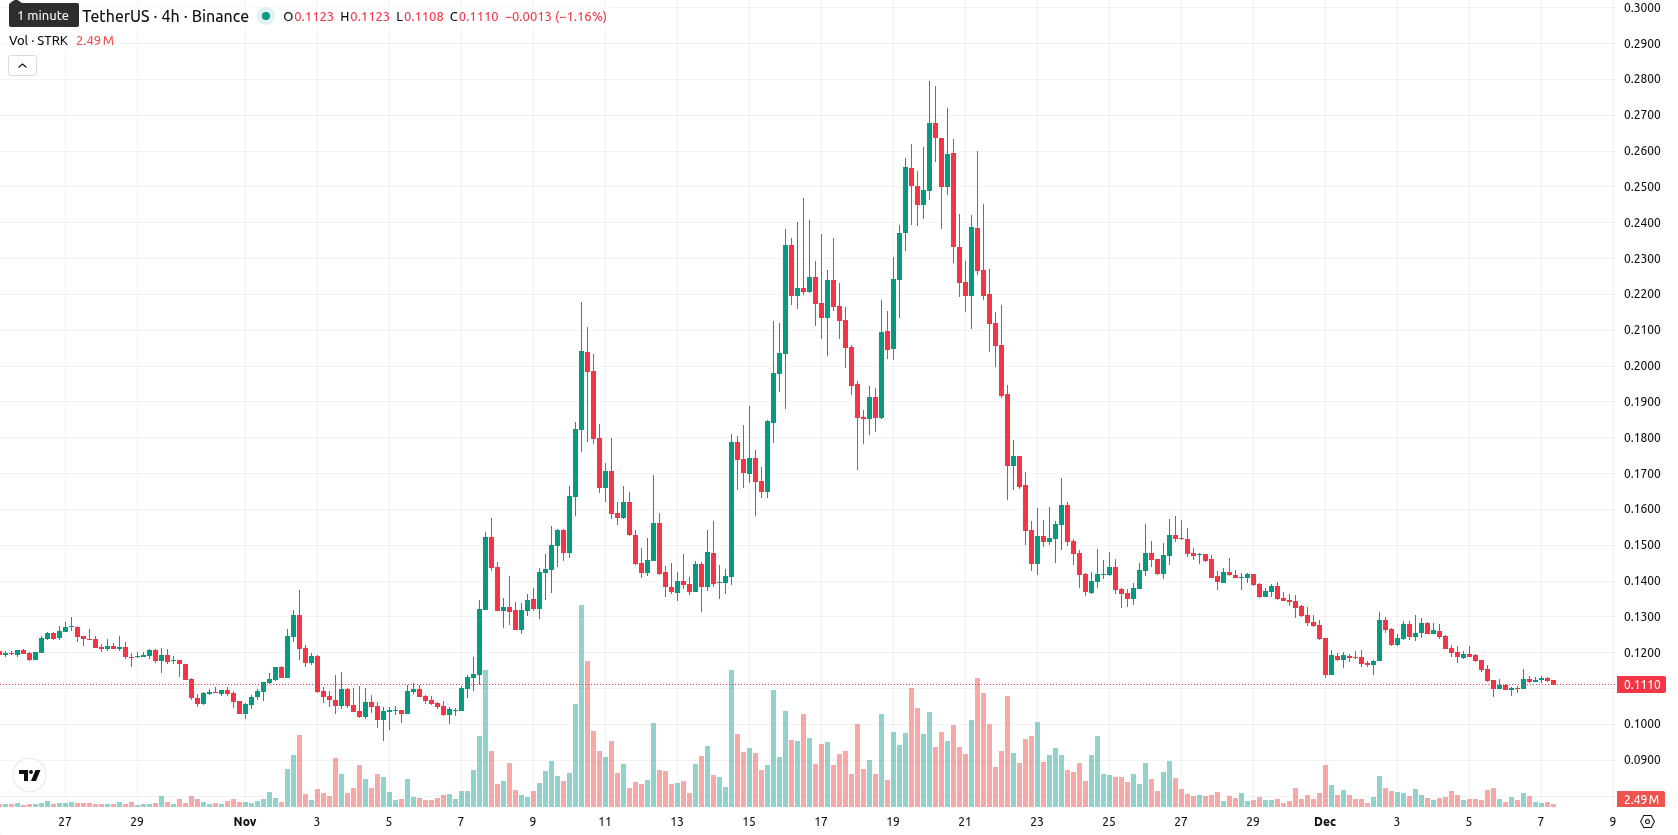
Starknet (STRK) is currently trading at $0.1127, sitting well below the MA-20 ($0.1530), MA-50 ($0.1395), and MA-200 ($0.1332), which signals ongoing bearish pressure in all observed trends. The nearest dynamic resistance is marked by the Ichimoku Kijun line at $0.1935, while immediate support appears around the current price level, with no major dynamic support visible until lower round numbers.
Highlights
- STRK trades at $0.1127, below MA-20 ($0.1530), MA-50 ($0.1395), and MA-200 ($0.1332), confirming persistent bearish momentum across all observed trends.
- Technical indicators show MACD (D1/W1) in strong sell mode, RSI at 39.7, and CCI at -89.5, signaling continued weakness despite oversold Stoch RSI conditions.
- Expected 5-day range is $0.1060 to $0.1250 with less than 20% probability of an upside move, sideways action likely unless STRK loses $0.1060 support.
Mixed momentum signals as intraday recovery meets persistent weakness
Momentum signals remain mixed, with MACD on both D1 and W1 in strong sell mode and RSI indicating persistent weakness — D1 RSI is at 39.7 and CCI is negative at -89.5, both pointing to a lack of upward drive. Stoch RSI on D1 suggests oversold conditions, while BBP is negative at -0.0168, reflecting sustained seller dominance; ADX of 21.9 (D1) notes a modest trend presence. The Awesome Oscillator’s sell signal supports this downside bias. Today, a small positive gap was observed at the open, the price sits close to the high of today’s narrow range ($0.1115 — $0.1132), daily volatility is low, and intraday price action shows a gentle recovery from early lows but lacks strong follow-through. This results in a mild upward intraday tone that partially contradicts the prevailing bearish momentum signals.
Downside risk prevails as volatility bands contain trading
For the coming 5 trading days, the expected price range is $0.1060 to $0.1250, reflecting a typical volatility band relative to current levels. The probability of a continued upward move is very low (less than 20%), making further downside far more likely. In the baseline scenario, the price is likely to oscillate sideways within this corridor as buyers attempt to absorb selling pressure. In a bullish scenario, a decisive move above $0.1250 could invite short covering and testing of higher resistance, while a drop below $0.1060 may accelerate further declines amid persistent negative sentiment.
Previously it was reported that Starknet traded below its key moving averages with persistent seller pressure across short, medium, and long-term timeframes, while short-term support was noted at $0.1179 and resistance near $0.1917. Daily indicators showed mixed momentum as MACD remained negative, ADX reflected growing trend strength, and oscillators suggested potential relief in selling pressure following a sharp intraday rebound.


-
 Afghanistan
-
 Albania
-
 Algeria
-
 Angola
-
 Argentina
-
 Armenia
-
 Australia
-
 Austria
-
 Azerbaijan
-
 Bahamas
-
 Bahrain
-
 Bangladesh
-
 Belarus
-
 Belgium
-
 Bolivia
-
 Botswana
-
 Brazil
-
 Brunei
-
 Bulgaria
-
 Cambodia
-
 Cameroon
-
 Canada
-
 Chile
Chile
-
 China
China
-
 Colombia
-
 Congo
Congo
-
 Costa Rica
-
 Cote d'Ivoire
-
 Croatia
-
 Cuba
Cuba
-
 Cyprus
-
 Czechia
-
 DR Congo
-
 Denmark
-
 Dominican Republic
-
 Ecuador
-
 Egypt
Egypt
-
 El Salvador
-
 Estonia
-
 Eswatini
-
 Ethiopia
-
 Finland
-
 France
-
 Georgia
-
 Germany
-
 Ghana
Ghana
-
 Greece
-
 Haiti
Haiti
-
 Hong Kong
-
 Hungary
-
 India
India
-
 Indonesia
-
 Iran, Islamic republic
-
 Iraq
Iraq
-
 Ireland
-
 Israel
-
 Italy
Italy
-
 Jamaica
-
 Japan
Japan
-
 Jordan
-
 Kazakhstan
-
 Kenya
Kenya
-
 Korea
Korea
-
 Kuwait
-
 Kyrgyzstan
-
 Laos
Laos
-
 Latvia
-
 Lebanon
-
 Lesotho
-
 Libya
Libya
-
 Lithuania
-
 Luxembourg
-
 Madagascar
-
 Malaysia
-
 Malta
Malta
-
 Mauritius
-
 Mexico
-
 Moldova
-
 Mongolia
-
 Montenegro
-
 Morocco
-
 Mozambique
-
 Myanmar
-
 Namibia
-
 Nepal
Nepal
-
 Netherlands
-
 New Zealand
-
 Nigeria
-
 North Macedonia
-
 Norway
-
 Oman
Oman
-
 Pakistan
-
 Palestine
-
 Panama
-
 Papua New Guinea
-
 Paraguay
-
 Peru
Peru
-
 Philippines
-
 Poland
-
 Portugal
-
 Puerto Rico
-
 Qatar
Qatar
-
 Reunion
-
 Romania
-
 Rwanda
-
 Saudi Arabia
-
 Serbia
-
 Singapore
-
 Slovakia
-
 Slovenia
-
 Somalia
-
 South Africa
-
 Spain
Spain
-
 Sri Lanka
-
 Sweden
-
 Switzerland
-
 Syria
Syria
-
 Taiwan
-
 Tajikistan
-
 Tanzania
-
 Thailand
-
 Trinidad and Tobago
-
 Tunisia
-
 Turkey
-
 UAE
UAE
-
 Uganda
-
 Ukraine
-
 United Kingdom
-
United States
-
 Uruguay
-
 Uzbekistan
-
 Venezuela
-
 Vietnam
-
 Yemen
Yemen
-
 Zambia
-
 Zimbabwe
- Forex
- Crypto
