
Intraday bullish flows — Celestia gains 7.30% amid ongoing bearish technicals

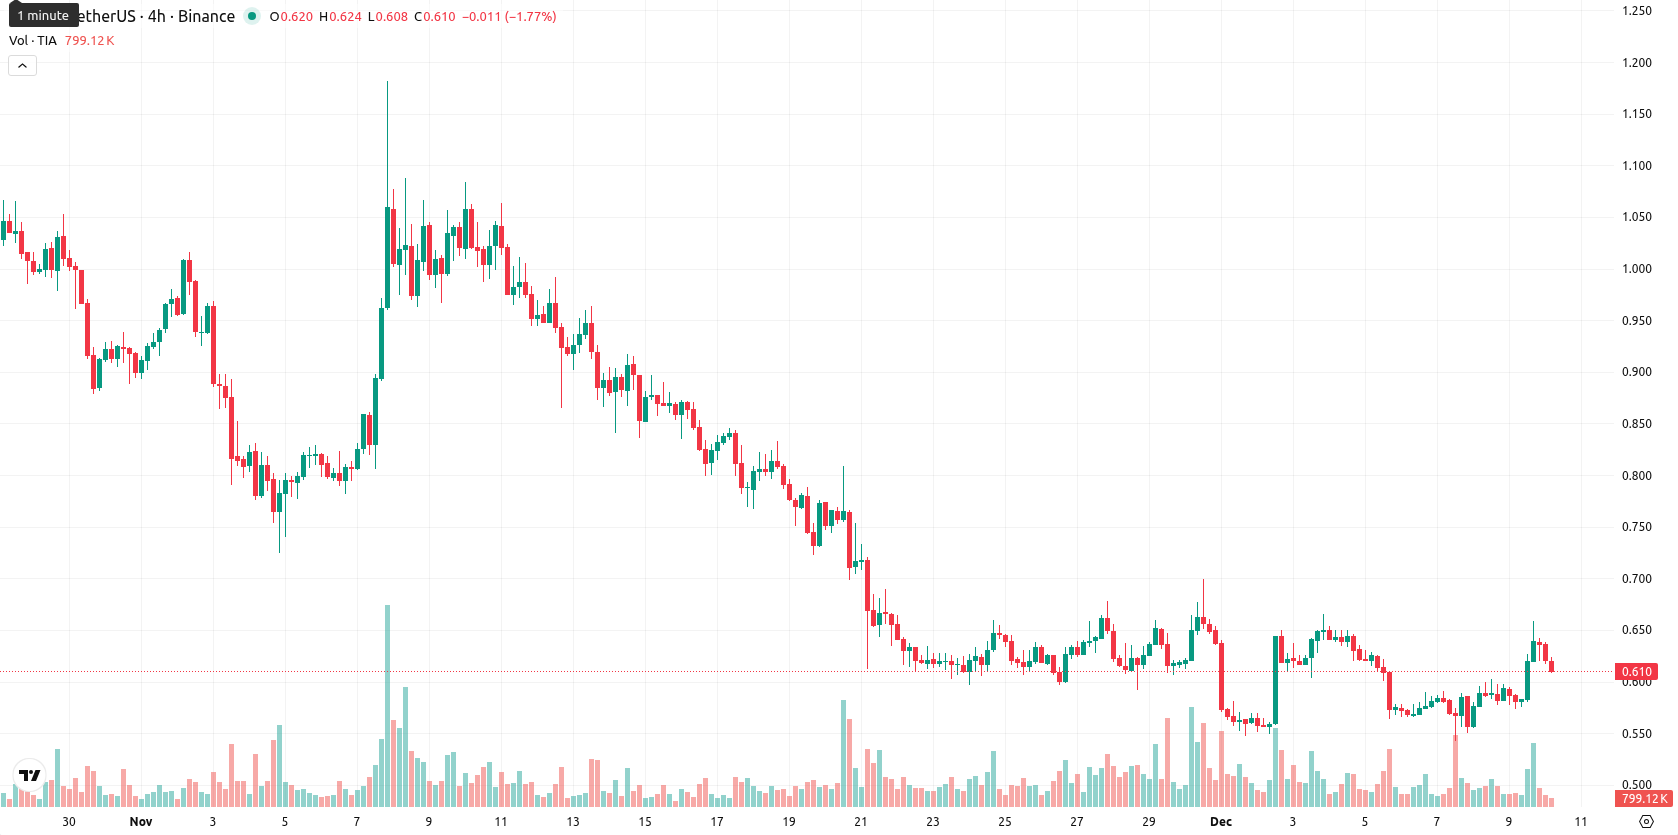
Celestia (TIA) is currently trading at $0.617, just below the MA-20 at $0.6226, and well beneath the MA-50 ($0.8079) and MA-200 ($1,4906). This setup reflects short-term consolidation with ongoing medium- and long-term bearish pressure, while the nearest dynamic resistance is the MA-20 with Ichimoku Kijun at $0.7295 above, and MA-20 acting as immediate support.
Highlights
- Celestia (TIA) is trading at $0.617, below its MA-20 ($0.6226), MA-50 ($0.8079), and MA-200 ($1.4906), reflecting ongoing bearish pressure despite a 7.30% intraday gain.
- Momentum indicators show mixed signals, with daily MACD and ADX turning bearish, RSI weak at 44, but Bull/Bear Power indicating some buyer dominance within the session.
- For the next five days, TIA is expected to consolidate between $0.555 and $0.675, with a bearish bias unless $0.675 resistance is surpassed or $0.555 support breaks.
Intraday bullish tone diverges from lingering bearish momentum
Momentum indicators on the daily timeframe are mixed: MACD signals strong bearishness and ADX confirms a trend is present but is also oriented to the downside. RSI is weak at 44, and Stoch RSI is at maximum overbought, while CCI suggests neutral conditions. Bull/Bear Power (BBP) favors the bulls, indicating some buyer dominance within the session. The Awesome Oscillator currently sits neutral. Today’s session opened with a clear upside gap from $0.575 to $0.636 and the price is now mid-range, up 7.30% on the day, with volatility at a moderate level. The tone is positive, but the divergence between bullish intraday flows and bearish momentum should be closely monitored.
Downside favored as weekly indicators reinforce bearish scenario
For the next five trading days, TIA is expected to trade between $0.555 and $0.675, staying within a typical volatility band relative to current levels. The probability of a further rise is very low (less than 20%), while a continued decline is more likely given bearish signals from weekly RSI, ADX, MACD, and MA-50. The baseline scenario suggests consolidation sideways between immediate support and resistance. A bullish scenario would require a breakout above $0.675, unlocking space toward the $0.7295 area, while a move below $0.555 may accelerate downside momentum toward $0.52.
Previously it was reported that Celestia (TIA) displayed short-term momentum above the 20-day moving average despite remaining below longer-term trend lines, with mixed technicals as MACD pointed to ongoing selling and RSI signaled oversold conditions. The price traded with high intraday volatility and resistance levels tightening near key indicators, suggesting sideways consolidation is likely while broader downside risks persist.


Latest Celestia News


-
 Afghanistan
-
 Albania
-
 Algeria
-
 Angola
-
 Argentina
-
 Armenia
-
 Australia
-
 Austria
-
 Azerbaijan
-
 Bahamas
-
 Bahrain
-
 Bangladesh
-
 Belarus
-
 Belgium
-
 Bolivia
-
 Botswana
-
 Brazil
-
 Brunei
-
 Bulgaria
-
 Cambodia
-
 Cameroon
-
 Canada
-
 Chile
Chile
-
 China
China
-
 Colombia
-
 Congo
Congo
-
 Costa Rica
-
 Cote d'Ivoire
-
 Croatia
-
 Cuba
Cuba
-
 Cyprus
-
 Czechia
-
 DR Congo
-
 Denmark
-
 Dominican Republic
-
 Ecuador
-
 Egypt
Egypt
-
 El Salvador
-
 Estonia
-
 Eswatini
-
 Ethiopia
-
 Finland
-
 France
-
 Georgia
-
 Germany
-
 Ghana
Ghana
-
 Greece
-
 Haiti
Haiti
-
 Hong Kong
-
 Hungary
-
 India
India
-
 Indonesia
-
 Iran, Islamic republic
-
 Iraq
Iraq
-
 Ireland
-
 Israel
-
 Italy
Italy
-
 Jamaica
-
 Japan
Japan
-
 Jordan
-
 Kazakhstan
-
 Kenya
Kenya
-
 Korea
Korea
-
 Kuwait
-
 Kyrgyzstan
-
 Laos
Laos
-
 Latvia
-
 Lebanon
-
 Lesotho
-
 Libya
Libya
-
 Lithuania
-
 Luxembourg
-
 Madagascar
-
 Malaysia
-
 Malta
Malta
-
 Mauritius
-
 Mexico
-
 Moldova
-
 Mongolia
-
 Montenegro
-
 Morocco
-
 Mozambique
-
 Myanmar
-
 Namibia
-
 Nepal
Nepal
-
 Netherlands
-
 New Zealand
-
 Nigeria
-
 North Macedonia
-
 Norway
-
 Oman
Oman
-
 Pakistan
-
 Palestine
-
 Panama
-
 Papua New Guinea
-
 Paraguay
-
 Peru
Peru
-
 Philippines
-
 Poland
-
 Portugal
-
 Puerto Rico
-
 Qatar
Qatar
-
 Reunion
-
 Romania
-
 Rwanda
-
 Saudi Arabia
-
 Serbia
-
 Singapore
-
 Slovakia
-
 Slovenia
-
 Somalia
-
 South Africa
-
 Spain
Spain
-
 Sri Lanka
-
 Sweden
-
 Switzerland
-
 Syria
Syria
-
 Taiwan
-
 Tajikistan
-
 Tanzania
-
 Thailand
-
 Trinidad and Tobago
-
 Tunisia
-
 Turkey
-
 UAE
UAE
-
 Uganda
-
 Ukraine
-
 United Kingdom
-
United States
-
 Uruguay
-
 Uzbekistan
-
 Venezuela
-
 Vietnam
-
 Yemen
Yemen
-
 Zambia
-
 Zimbabwe
- Forex
- Crypto
