

Bitcoin price prediction: Will global regulation spark upside? BTC gains 1.38%

Bitcoin (BTC) is trading above the MA-20 ($88,120.43) but remains below both the MA-50 ($90,164.73) and MA-200 ($107,080.66), signaling a short-term bullish bias while facing medium- to long-term resistance.
BTC price prediction
Current price:
$59,085.55
-2894.45
4.67%
Real-time Data
00:31
Daily range
58880
 59059.75
Weekly range
57778.35
66132.01
66132.01
Loading...
Highlights
- Institutional adoption surged in late 2025 and early 2026, with over 200 companies holding Bitcoin on balance sheets and spot Bitcoin ETFs receiving $45 billion to $56 billion in inflows.
- MicroStrategy, now rebranded as Strategy, retained its position as the largest corporate Bitcoin holder with a total acquisition exceeding 672,000 BTC.
- The OECD launched a comprehensive global regulatory framework for crypto tax reporting, covering 48 jurisdictions beginning in 2026.
Institutional inflows and new regulations drive adoption momentum
Institutional adoption continued to expand in late 2025 and early 2026 as over 200 companies held Bitcoin on their balance sheets and spot Bitcoin ETFs attracted between $45 billion and $56 billion in inflows. MicroStrategy, recently rebranded as Strategy, maintained its lead with a total of more than 672,000 BTC acquired. The Organization for Economic Cooperation and Development (OECD) also initiated a major global regulatory framework for crypto tax reporting, covering 48 jurisdictions beginning in 2026.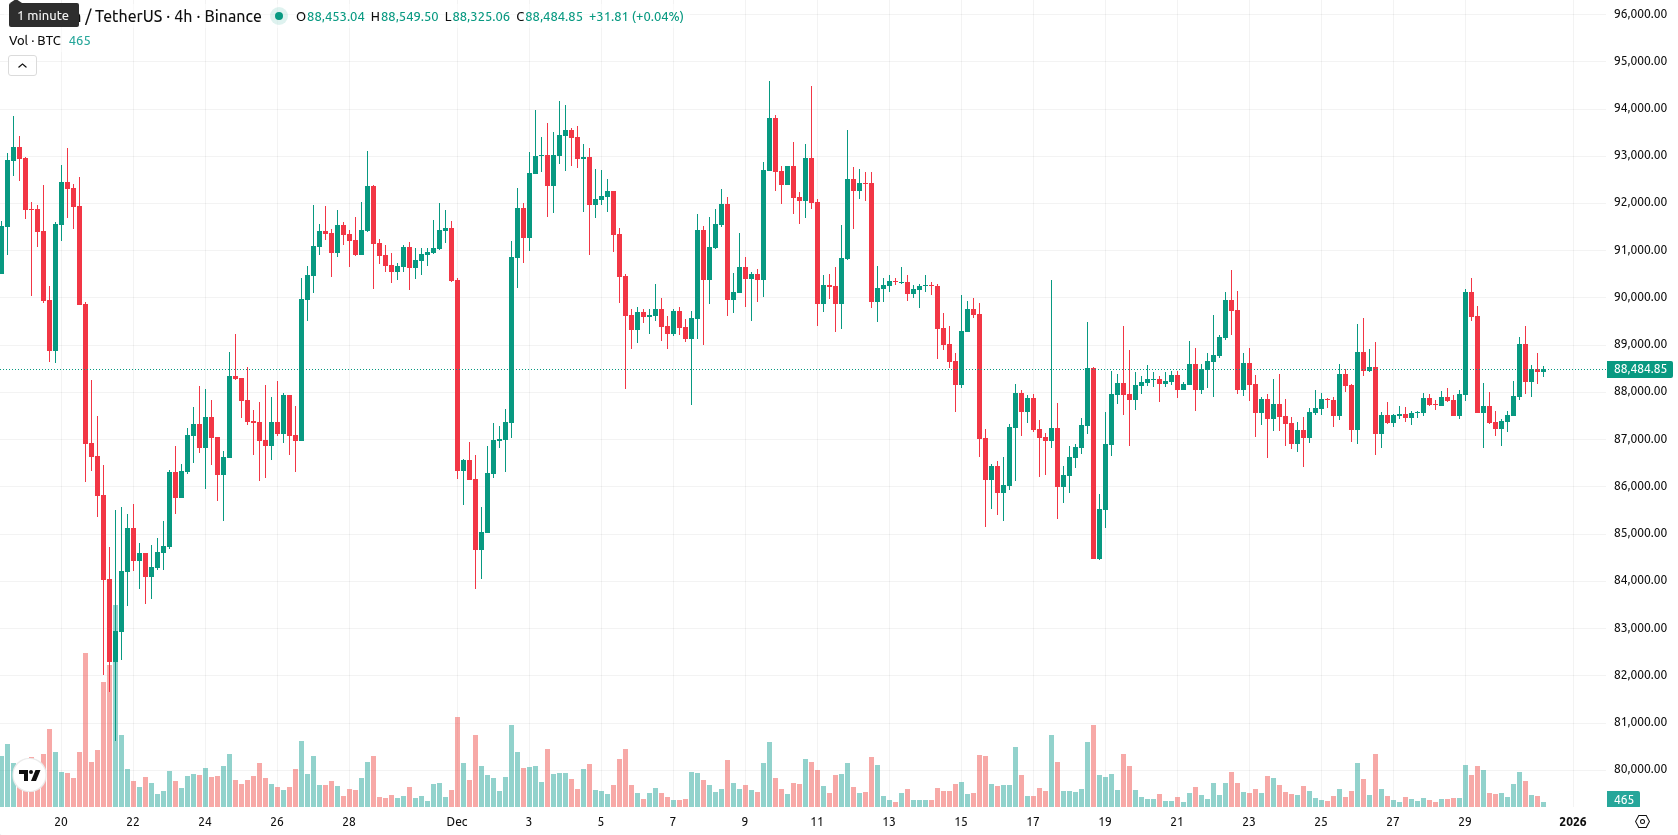
Mixed momentum and overbought signals as volatility persists
The nearest dynamic support for Bitcoin is at the MA-20, while the Ichimoku Kijun at $89,519.50 currently acts as resistance. Momentum indicators are mixed: ADX (22.39) signals a weak trend and the daily MACD points to strong selling momentum, while RSI is neutral at 48.23 and Stoch RSI is fully overbought at 100.00. Bull/Bear Power highlights continued overbought conditions and intraday buyer dominance, though this is not supported by daily MACD or ADX, and the Awesome Oscillator remains neutral, failing to confirm the intraday move. The session opened with a gap up from $87,255.97 to $88,445.33; with the current price near the daily high of $88,808.30, volatility is moderate, but momentum and oscillator signals diverge.Sideways consolidation expected as weekly indicators remain bearish
For the coming week, Bitcoin is expected to remain in a volatility band between $87,003 and $89,511. The probability of further significant price increases is low (below 20%) as dominant weekly indicators including RSI, ADX, MACD, and MA-50 indicate ongoing selling pressure or weakness. The base case is for price to consolidate sideways within this range, with any breakout above $89,519 potentially triggering a short-lived upward move. A decline below $88,120 or toward $87,000 could accelerate additional selling activity.
Anton Kharitonov, Traders Union expert, notes that Bitcoin remains capped by key resistance on both technical and momentum indicators. He sees continued selling pressure, with intraday demand not confirmed by broader trend signals. Further institutional inflows and new regulations do not offset the lack of bullish confirmation. "Until Bitcoin reclaims $89,519 with real follow-through, I remain cautious and expect consolidation to continue."
Last time, analysts noted that the anticipated year-end Santa Claus Rally in crypto failed to materialize in 2025, with major assets instead mirroring macroeconomic signals, persistent tight financial conditions, and institutional portfolio rebalancing activity. The trend shifted from seasonal optimism to caution, with market momentum exhausted earlier in the year, key support levels holding but lacking new upward catalysts, and technical indicators reflecting consolidation rather than breakout.
Source of Data:
BTC Price Analysis by TU
The analysis is based on a proprietary model combining technical, on-chain, and expert data. Not investment advice. See
methodology
The information is based on forecasts and does not constitute investment advice or a guarantee of future results. Market conditions may change. See our Disclaimer and Editorial Integrity for details.
Subscribe to TU news


Did you like the article?







Top News


Top 5 companies for you

United States
-
 Afghanistan
-
 Albania
-
 Algeria
-
 Angola
-
 Argentina
-
 Armenia
-
 Australia
-
 Austria
-
 Azerbaijan
-
 Bahamas
-
 Bahrain
-
 Bangladesh
-
 Belarus
-
 Belgium
-
 Bolivia
-
 Botswana
-
 Brazil
-
 Brunei
-
 Bulgaria
-
 Cambodia
-
 Cameroon
-
 Canada
-
 Chile
-
 China
-
 Colombia
-
 Congo
-
 Costa Rica
-
 Cote d'Ivoire
-
 Croatia
-
 Cuba
-
 Cyprus
-
 Czechia
-
 DR Congo
-
 Denmark
-
 Dominican Republic
-
 Ecuador
-
 Egypt
-
 El Salvador
-
 Estonia
-
 Eswatini
-
 Ethiopia
-
 Finland
-
 France
-
 Georgia
-
 Germany
-
 Ghana
-
 Greece
-
 Haiti
-
 Hong Kong
-
 Hungary
-
 India
-
 Indonesia
-
 Iran, Islamic republic
-
 Iraq
-
 Ireland
-
 Israel
-
 Italy
-
 Jamaica
-
 Japan
-
 Jordan
-
 Kazakhstan
-
 Kenya
-
 Korea
-
 Kuwait
-
 Kyrgyzstan
-
 Laos
-
 Latvia
-
 Lebanon
-
 Lesotho
-
 Libya
-
 Lithuania
-
 Luxembourg
-
 Madagascar
-
 Malaysia
-
 Malta
-
 Mauritius
-
 Mexico
-
 Moldova
-
 Mongolia
-
 Montenegro
-
 Morocco
-
 Mozambique
-
 Myanmar
-
 Namibia
-
 Nepal
-
 Netherlands
-
 New Zealand
-
 Nigeria
-
 North Macedonia
-
 Norway
-
 Oman
-
 Pakistan
-
 Palestine
-
 Panama
-
 Papua New Guinea
-
 Paraguay
-
 Peru
-
 Philippines
-
 Poland
-
 Portugal
-
 Puerto Rico
-
 Qatar
-
 Reunion
-
 Romania
-
 Rwanda
-
 Saudi Arabia
-
 Serbia
-
 Singapore
-
 Slovakia
-
 Slovenia
-
 Somalia
-
 South Africa
-
 Spain
-
 Sri Lanka
-
 Sweden
-
 Switzerland
-
 Syria
-
 Taiwan
-
 Tajikistan
-
 Tanzania
-
 Thailand
-
 Trinidad and Tobago
-
 Tunisia
-
 Turkey
-
 UAE
-
 Uganda
-
 Ukraine
-
 United Kingdom
-
United States
-
 Uruguay
-
 Uzbekistan
-
 Venezuela
-
 Vietnam
-
 Yemen
-
 Zambia
-
 Zimbabwe
- Forex
- Crypto










Live News


