
Solana price prediction: SOL closes 2025 with 34% loss inside triangle compression

Solana price is trading around $124.5 on Thursday, January 1, 2026, in a quiet session reflecting holiday conditions and limited investor activity. Price action has stayed compressed within an ascending triangle formation for over 10 days, suggesting a buildup of momentum. The triangle’s top resistance sits at $129, while the rising support trendline currently holds near $122.7. This structure highlights investor hesitation after months of broader price weakness.
Highlights
- Solana forms triangle pattern between $122.7 and $129 after 34% yearly drop.
- Long traders dominate positioning, but the bearish trend threatens upside breakout potential.
- U.S. crypto policy clarity remains key bullish trigger as price stalls below all major EMAs.
From September to December 2025, Solana lost nearly 50% of its value after falling from above $250. That four-month downtrend culminated in an eight-month low of $117 in early December before closing the year at $124.5, locking in a 34% loss for 2025. Despite the steep decline, the official Solana account described 2025 as a successful year due to institutional inflows, the launch of a Solana ETF, and other milestone achievements.
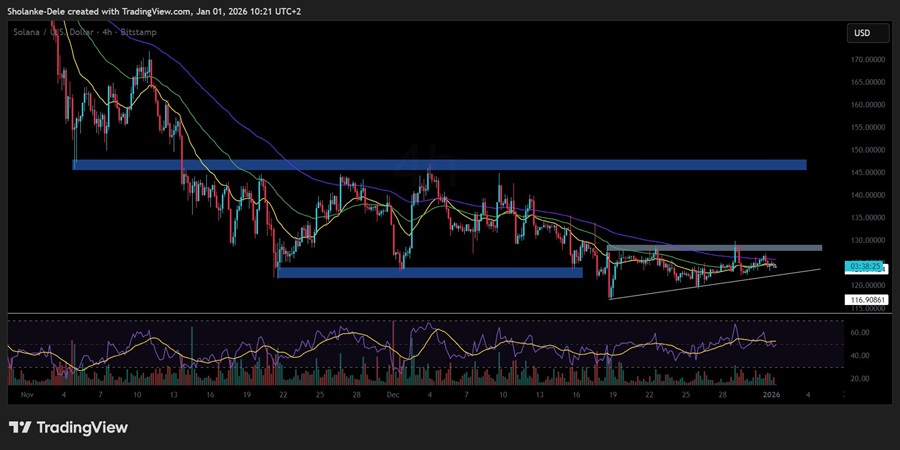
Solana price chart (Nov - Dec 2025). Source: TradingView
Technical indicators on the daily chart reflect the bearish tilt in structure. Solana price is still trading below the 20, 50, and 100-day EMA levels. The daily RSI reads 44, consistent with its three-month stretch in bearish territory. Although the RSI on the 4-hour chart has moved to neutral, this merely echoes the absence of directional momentum during the current phase of consolidation.
Market focus shifts to triangle breakout and upcoming U.S. crypto legislation
Throughout the triangle pattern’s formation, Solana’s long-to-short ratio has fluctuated between 3.5 and 5. This elevated reading shows that leveraged traders are skewed heavily to the long side, expecting an upward breakout. However, the presence of declining volume and failure to breach overhead resistance weakens the bullish case. Technically, the setup leans toward a potential downside breakout, especially considering the larger trend that preceded the triangle.
Market participants are closely monitoring both technical resolution and policy signals. Bitwise CIO Matt Hougan recently commented that Solana could reach new all-time highs if the United States enacts the Clarity Act. This proposed legislation would provide a clear regulatory framework for assets. Until such macro drivers emerge, price direction will likely hinge on whether Solana breaks above $129 or slides below $122.7 to confirm the next move.
In recent analysis, we discussed how Solana broke its rising trendline after a failed rally confirmed a broader bearish structure. Long positioning rose slightly, but weak open interest and short bias pointed to a likely third straight monthly loss.


-
 Afghanistan
-
 Albania
-
 Algeria
-
 Angola
-
 Argentina
-
 Armenia
-
 Australia
-
 Austria
-
 Azerbaijan
-
 Bahamas
-
 Bahrain
-
 Bangladesh
-
 Belarus
-
 Belgium
-
 Bolivia
-
 Botswana
-
 Brazil
-
 Brunei
-
 Bulgaria
-
 Cambodia
-
 Cameroon
-
 Canada
-
 Chile
Chile
-
 China
China
-
 Colombia
-
 Congo
Congo
-
 Costa Rica
-
 Cote d'Ivoire
-
 Croatia
-
 Cuba
Cuba
-
 Cyprus
-
 Czechia
-
 DR Congo
-
 Denmark
-
 Dominican Republic
-
 Ecuador
-
 Egypt
Egypt
-
 El Salvador
-
 Estonia
-
 Eswatini
-
 Ethiopia
-
 Finland
-
 France
-
 Georgia
-
 Germany
-
 Ghana
Ghana
-
 Greece
-
 Haiti
Haiti
-
 Hong Kong
-
 Hungary
-
 India
India
-
 Indonesia
-
 Iran, Islamic republic
-
 Iraq
Iraq
-
 Ireland
-
 Israel
-
 Italy
Italy
-
 Jamaica
-
 Japan
Japan
-
 Jordan
-
 Kazakhstan
-
 Kenya
Kenya
-
 Korea
Korea
-
 Kuwait
-
 Kyrgyzstan
-
 Laos
Laos
-
 Latvia
-
 Lebanon
-
 Lesotho
-
 Libya
Libya
-
 Lithuania
-
 Luxembourg
-
 Madagascar
-
 Malaysia
-
 Malta
Malta
-
 Mauritius
-
 Mexico
-
 Moldova
-
 Mongolia
-
 Montenegro
-
 Morocco
-
 Mozambique
-
 Myanmar
-
 Namibia
-
 Nepal
Nepal
-
 Netherlands
-
 New Zealand
-
 Nigeria
-
 North Macedonia
-
 Norway
-
 Oman
Oman
-
 Pakistan
-
 Palestine
-
 Panama
-
 Papua New Guinea
-
 Paraguay
-
 Peru
Peru
-
 Philippines
-
 Poland
-
 Portugal
-
 Puerto Rico
-
 Qatar
Qatar
-
 Reunion
-
 Romania
-
 Rwanda
-
 Saudi Arabia
-
 Serbia
-
 Singapore
-
 Slovakia
-
 Slovenia
-
 Somalia
-
 South Africa
-
 Spain
Spain
-
 Sri Lanka
-
 Sweden
-
 Switzerland
-
 Syria
Syria
-
 Taiwan
-
 Tajikistan
-
 Tanzania
-
 Thailand
-
 Trinidad and Tobago
-
 Tunisia
-
 Turkey
-
 UAE
UAE
-
 Uganda
-
 Ukraine
-
 United Kingdom
-
United States
-
 Uruguay
-
 Uzbekistan
-
 Venezuela
-
 Vietnam
-
 Yemen
Yemen
-
 Zambia
-
 Zimbabwe
- Forex
- Crypto
