
Jito: bullish undertones and high volatility drive a 7.27% surge despite overbought risks

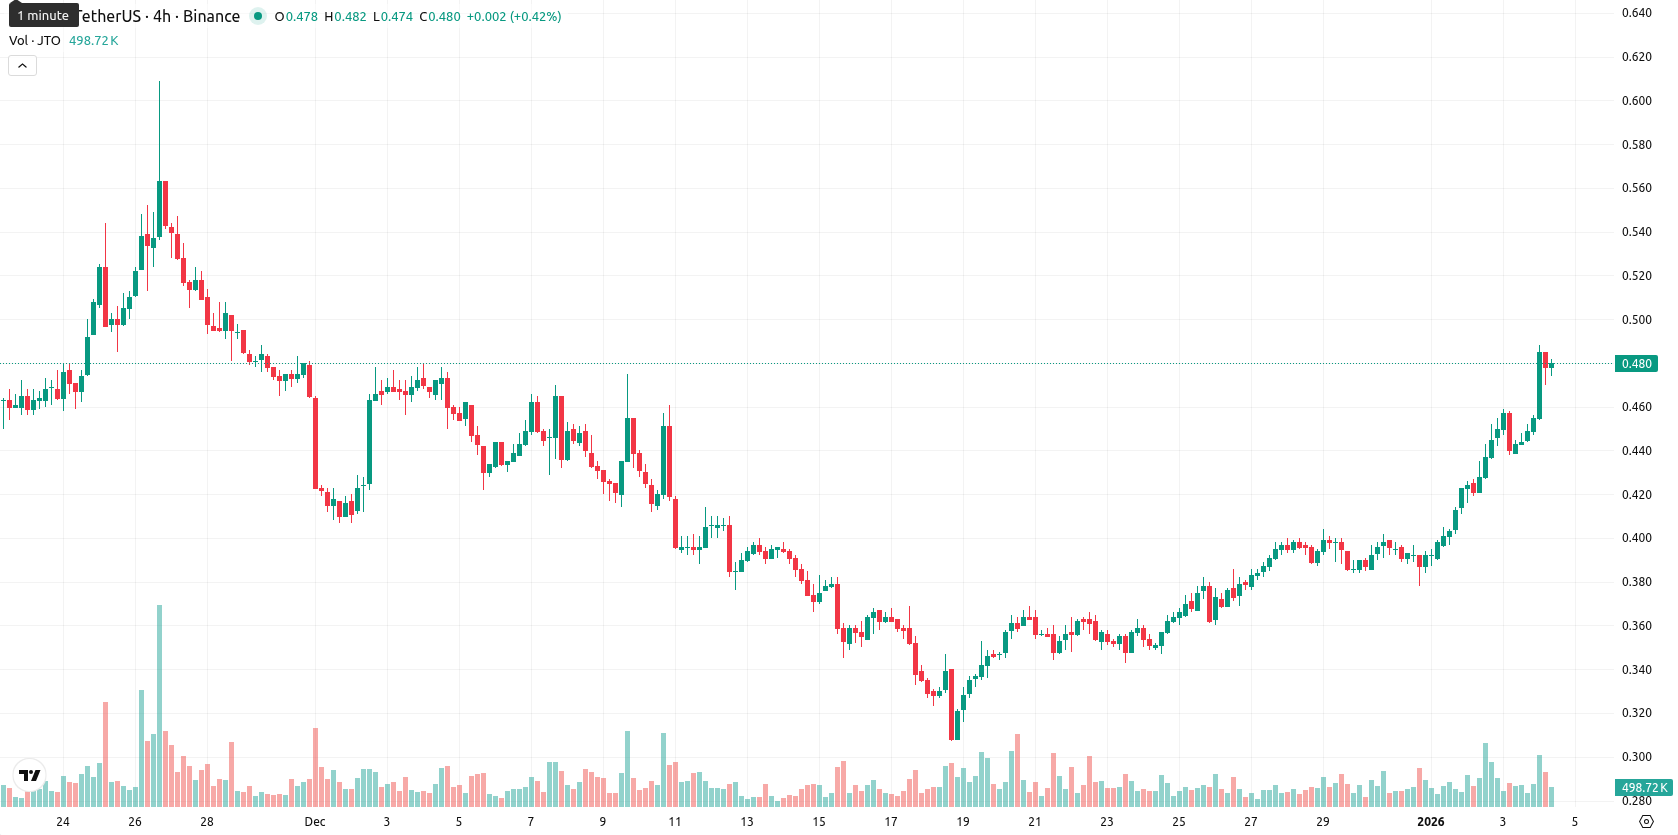
Jito (JTO) is trading at $0.472, placing it above the MA-20 ($0.3779) and MA-50 ($0.4360), but still far below the longer-term MA-200 ($1.3505). This pattern signals a strong short- and medium-term bullish bias, while the broader trend remains under long-term bearish pressure; the nearest key dynamic resistance is the MA-50 at $0.4360, while the most recent Kijun level from Ichimoku at $0.3910 acts as immediate support.
 0.6252
0.6550
0.6252
0.6550
Highlights
- Jito will unlock 11.3 million JTO tokens, worth approximately $5.39 million and representing 1.14% of its total market capitalization.
- About 37.28% of Jito’s total token supply has now been unlocked, indicating a significant increase in token liquidity.
- Jito’s total value locked has declined sharply, falling from a peak of $3.37 billion to roughly $1.9 billion, reflecting decreased asset commitment.
Token unlock and TVL decline as supply pressures intensify
Jito, a major project in the Solana network, is set for a scheduled token unlock of 11.3 million JTO tokens valued at roughly $5.39 million, accounting for 1.14% of the total market capitalization. Approximately 37.28% of Jito's total token supply has already been unlocked. The platform’s total value locked, primarily held in staked Solana tokens, has also decreased from a peak of $3.37 billion to about $1.9 billion.
Overbought readings and mixed momentum increase reversal risk
Momentum signals are mixed, with the daily MACD appearing neutral and the ADX at 34.9 suggesting a relatively strong trend, yet its forecast signals a risk of reversal. Overbought readings from the Stochastic RSI (100) and CCI (197.18) point to stretched short-term conditions, while the RSI sits in bullish territory at 60.84. Bull/Bear Power shows buyers holding the upper hand intraday, and the latest move — a climb of 7.27% to $0.472 — occurred without a significant gap between sessions and leaves the price near the day’s highs, highlighting high volatility and robust strength after the open. Despite the directional momentum, the overbought signals and neutral MACD introduce a divergence, suggesting caution as the rally appears extended and may face resistance.
Downside risk favored as upside probability remains limited
Looking ahead over the next five days, the anticipated range is $0.425 to $0.490, centered around the current price to reflect typical volatility. The probability of further price increases is very low (less than 20%), making a downside move much more likely in the near term. In the baseline scenario, JTO is expected to consolidate between support ($0.425) and resistance ($0.490). A bullish scenario would see a breakout above $0.490 if buying momentum persists, while a bearish breakdown below $0.425 could trigger deeper retracements as overbought conditions unwind and longer-term downtrends continue to weigh.
Previously it was reported that Jito (JTO) is showing a strong short- to medium-term bullish bias, with the price trading comfortably above its 20- and 50-day moving averages but still well below long-term resistance defined by the 200-day average. Despite firm intraday momentum and dominance by buyers, technical indicators such as the mixed MACD, high RSI, and overbought readings from Stoch RSI and CCI suggest caution, with consolidation expected between support at $0.4100 and resistance at $0.5000 in the coming week.








-
 Afghanistan
-
 Albania
-
 Algeria
-
 Angola
-
 Argentina
-
 Armenia
-
 Australia
-
 Austria
-
 Azerbaijan
-
 Bahamas
-
 Bahrain
-
 Bangladesh
-
 Belarus
-
 Belgium
-
 Bolivia
-
 Botswana
-
 Brazil
-
 Brunei
-
 Bulgaria
-
 Cambodia
-
 Cameroon
-
 Canada
-
 Chile
Chile
-
 China
China
-
 Colombia
-
 Congo
Congo
-
 Costa Rica
-
 Cote d'Ivoire
-
 Croatia
-
 Cuba
Cuba
-
 Cyprus
-
 Czechia
-
 DR Congo
-
 Denmark
-
 Dominican Republic
-
 Ecuador
-
 Egypt
Egypt
-
 El Salvador
-
 Estonia
-
 Eswatini
-
 Ethiopia
-
 Finland
-
 France
-
 Georgia
-
 Germany
-
 Ghana
Ghana
-
 Greece
-
 Haiti
Haiti
-
 Hong Kong
-
 Hungary
-
 India
India
-
 Indonesia
-
 Iran, Islamic republic
-
 Iraq
Iraq
-
 Ireland
-
 Israel
-
 Italy
Italy
-
 Jamaica
-
 Japan
Japan
-
 Jordan
-
 Kazakhstan
-
 Kenya
Kenya
-
 Korea
Korea
-
 Kuwait
-
 Kyrgyzstan
-
 Laos
Laos
-
 Latvia
-
 Lebanon
-
 Lesotho
-
 Libya
Libya
-
 Lithuania
-
 Luxembourg
-
 Madagascar
-
 Malaysia
-
 Malta
Malta
-
 Mauritius
-
 Mexico
-
 Moldova
-
 Mongolia
-
 Montenegro
-
 Morocco
-
 Mozambique
-
 Myanmar
-
 Namibia
-
 Nepal
Nepal
-
 Netherlands
-
 New Zealand
-
 Nigeria
-
 North Macedonia
-
 Norway
-
 Oman
Oman
-
 Pakistan
-
 Palestine
-
 Panama
-
 Papua New Guinea
-
 Paraguay
-
 Peru
Peru
-
 Philippines
-
 Poland
-
 Portugal
-
 Puerto Rico
-
 Qatar
Qatar
-
 Reunion
-
 Romania
-
 Rwanda
-
 Saudi Arabia
-
 Serbia
-
 Singapore
-
 Slovakia
-
 Slovenia
-
 Somalia
-
 South Africa
-
 Spain
Spain
-
 Sri Lanka
-
 Sweden
-
 Switzerland
-
 Syria
Syria
-
 Taiwan
-
 Tajikistan
-
 Tanzania
-
 Thailand
-
 Trinidad and Tobago
-
 Tunisia
-
 Turkey
-
 UAE
UAE
-
 Uganda
-
 Ukraine
-
 United Kingdom
-
United States
-
 Uruguay
-
 Uzbekistan
-
 Venezuela
-
 Vietnam
-
 Yemen
Yemen
-
 Zambia
-
 Zimbabwe
- Forex
- Crypto












