
+1.76% for Shiba Inu — traders eye consolidation despite modest volatility

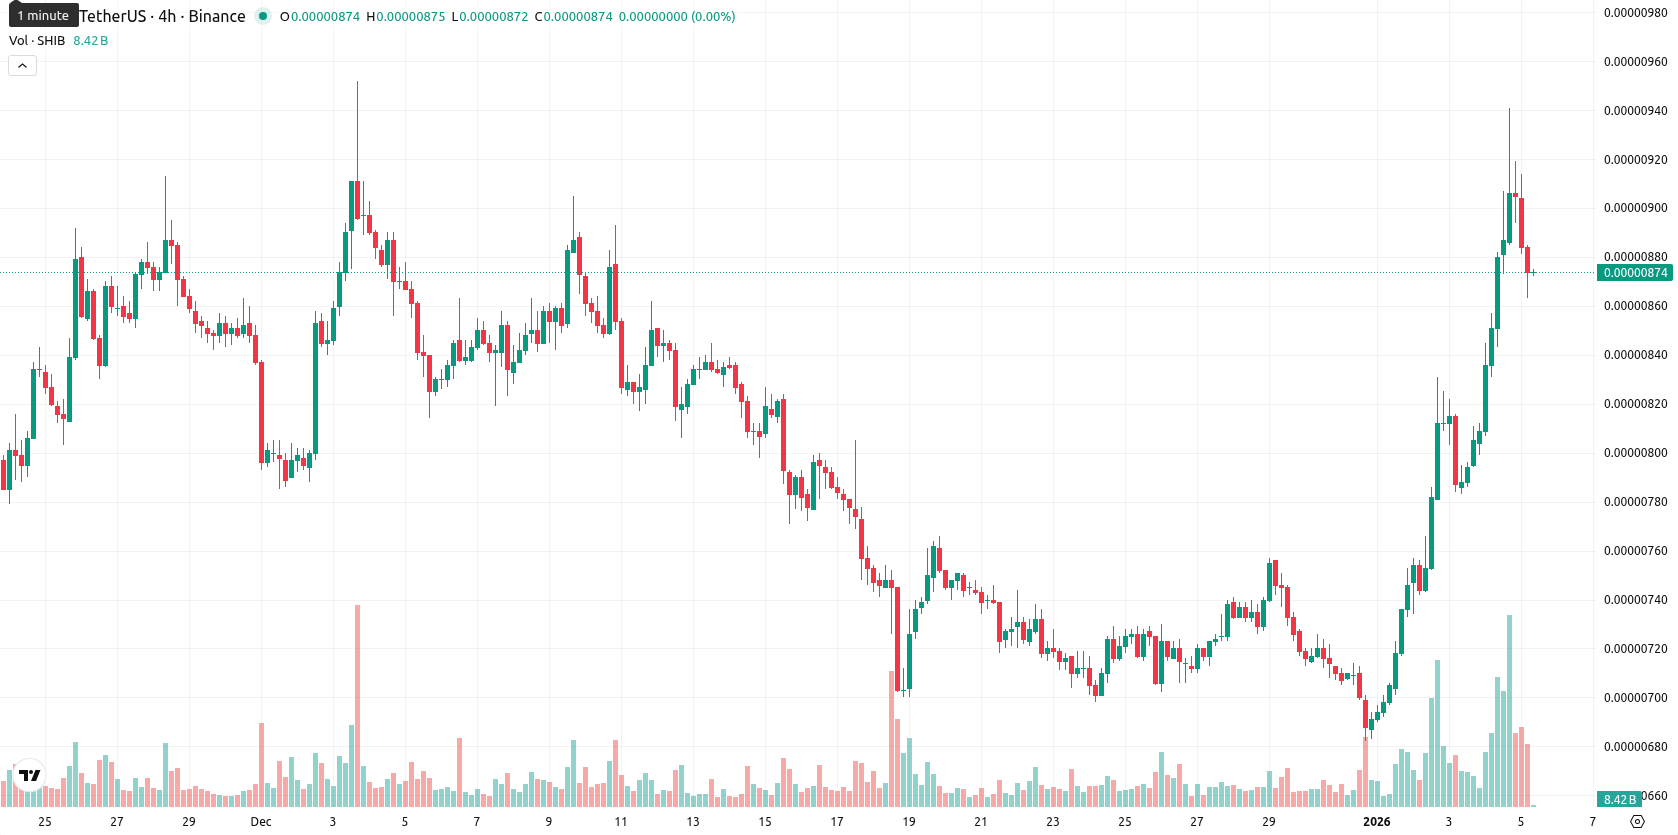
Shiba Inu (SHIB) is currently trading at $0.0000087, which is well above both the MA-20 ($0.00000745) and MA-50 ($0.00000803), but remains below the MA-200 ($0.00001102). This arrangement indicates strengthening short- and medium-term bullish momentum, while longer-term resistance persists overhead.
Highlights
- SHIB is trading at $0.0000087, above the MA-20 ($0.00000745) and MA-50 ($0.00000803), but still below the MA-200 ($0.00001102), signaling short- and medium-term bullishness with long-term resistance overhead.
- Momentum indicators are mixed, with ADX and BBP pointing to buyers, while MACD and Awesome Oscillator remain neutral and RSI nears overbought at just below 70.
- SHIB is expected to consolidate within a $0.0000083–$0.0000089 range over five days, with less than 20 probability of a sustained breakout this week amid weak weekly momentum.
Mixed momentum and technical divergence as price consolidates
The nearest dynamic support is provided by the Ichimoku Kijun at $0.00000811, with resistance now at the MA-50, just above the current market price. Momentum signals are somewhat mixed. The daily MACD is neutral and the ADX on D1 supports buying, reflecting a moderate trend but not strong follow-through. RSI sits just below 70, indicating elevated momentum, and both CCI and Stoch RSI point to overbought conditions. The Bull/Bear Power (BBP) favors buyers, showing positive intraday pressure, while the Awesome Oscillator remains neutral. Today's session opened at $0.0000090 (just above the previous close of $0.000008), showing only a small gap up. The current price is near the middle of today’s $0.0000086 – $0.0000091 range, volatility is moderate, and the tone is consolidative after early strength. Oscillator signals and intraday price action are somewhat divergent, so traders should watch for potential near-term corrections.
Low upside risk as weekly momentum signals consolidation
For the next five trading days, the expected price range is $0.0000083 to $0.0000089, keeping the outlook broadly in line with typical volatility relative to current levels. Based on weak weekly momentum (with all weekly signals issuing Sell), there is a very low probability (less than 20%) that SHIB will see a sustained price increase this week. The more likely scenario is continued consolidation or mild weakness, with sideways movement within the implied volatility band. A bullish scenario would require a break above $0.0000089, targeting resistance at $0.0000091, while a move below $0.0000083 could test dynamic support at $0.0000081, though significant downside momentum appears limited.
Last time, analysts noted that Shiba Inu exhibited short- and medium-term momentum as it traded above the 20- and 50-day moving averages but remained under long-term resistance. Mixed signals emerged as oscillators pointed to overbought conditions and the MACD maintained a bearish stance, while resistance near the MA-50 and Kijun level limited immediate upside.


-
 Afghanistan
-
 Albania
-
 Algeria
-
 Angola
-
 Argentina
-
 Armenia
-
 Australia
-
 Austria
-
 Azerbaijan
-
 Bahamas
-
 Bahrain
-
 Bangladesh
-
 Belarus
-
 Belgium
-
 Bolivia
-
 Botswana
-
 Brazil
-
 Brunei
-
 Bulgaria
-
 Cambodia
-
 Cameroon
-
 Canada
-
 Chile
Chile
-
 China
China
-
 Colombia
-
 Congo
Congo
-
 Costa Rica
-
 Cote d'Ivoire
-
 Croatia
-
 Cuba
Cuba
-
 Cyprus
-
 Czechia
-
 DR Congo
-
 Denmark
-
 Dominican Republic
-
 Ecuador
-
 Egypt
Egypt
-
 El Salvador
-
 Estonia
-
 Eswatini
-
 Ethiopia
-
 Finland
-
 France
-
 Georgia
-
 Germany
-
 Ghana
Ghana
-
 Greece
-
 Haiti
Haiti
-
 Hong Kong
-
 Hungary
-
 India
India
-
 Indonesia
-
 Iran, Islamic republic
-
 Iraq
Iraq
-
 Ireland
-
 Israel
-
 Italy
Italy
-
 Jamaica
-
 Japan
Japan
-
 Jordan
-
 Kazakhstan
-
 Kenya
Kenya
-
 Korea
Korea
-
 Kuwait
-
 Kyrgyzstan
-
 Laos
Laos
-
 Latvia
-
 Lebanon
-
 Lesotho
-
 Libya
Libya
-
 Lithuania
-
 Luxembourg
-
 Madagascar
-
 Malaysia
-
 Malta
Malta
-
 Mauritius
-
 Mexico
-
 Moldova
-
 Mongolia
-
 Montenegro
-
 Morocco
-
 Mozambique
-
 Myanmar
-
 Namibia
-
 Nepal
Nepal
-
 Netherlands
-
 New Zealand
-
 Nigeria
-
 North Macedonia
-
 Norway
-
 Oman
Oman
-
 Pakistan
-
 Palestine
-
 Panama
-
 Papua New Guinea
-
 Paraguay
-
 Peru
Peru
-
 Philippines
-
 Poland
-
 Portugal
-
 Puerto Rico
-
 Qatar
Qatar
-
 Reunion
-
 Romania
-
 Rwanda
-
 Saudi Arabia
-
 Serbia
-
 Singapore
-
 Slovakia
-
 Slovenia
-
 Somalia
-
 South Africa
-
 Spain
Spain
-
 Sri Lanka
-
 Sweden
-
 Switzerland
-
 Syria
Syria
-
 Taiwan
-
 Tajikistan
-
 Tanzania
-
 Thailand
-
 Trinidad and Tobago
-
 Tunisia
-
 Turkey
-
 UAE
UAE
-
 Uganda
-
 Ukraine
-
 United Kingdom
-
United States
-
 Uruguay
-
 Uzbekistan
-
 Venezuela
-
 Vietnam
-
 Yemen
Yemen
-
 Zambia
-
 Zimbabwe
- Forex
- Crypto
