
Theta rallies 7.95% as technical buyers hold firm above support

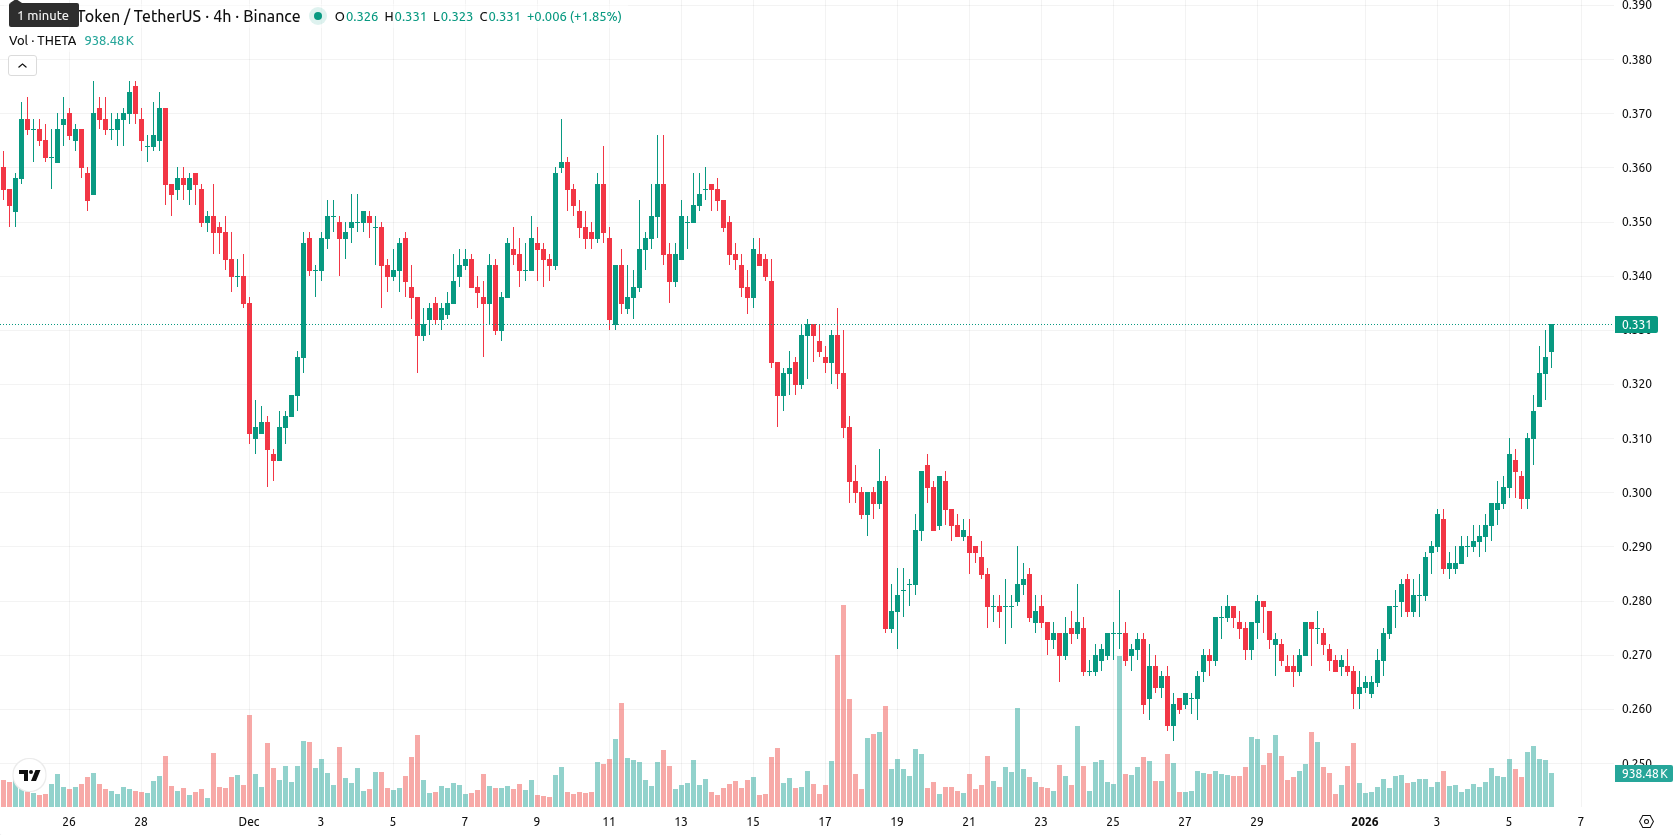
Theta (THETA) is trading at $0.326, above its MA-20 ($0.2817) and slightly above MA-50 ($0.3241), but still well below the MA-200 ($0.6157). This indicates short-term strength for Theta, although longer-term price action remains under bearish pressure.
Highlights
- THETA trades at $0.326, above its MA-20 ($0.2817) and MA-50 ($0.3241), but far below MA-200 ($0.6157), reflecting short-term upside within a longer-term bearish trend.
- Diverging momentum signals—MACD (strong sell), ADX (strong trend favoring sellers), and overbought Stoch RSI and CCI—suggest elevated risk of correction despite current intraday strength and 7.95% session gain.
- Five-day range expected between $0.315–$0.345, with probability of price increase under 20% and base case favoring sideways consolidation unless $0.345–$0.35 resistance is decisively breached.
Resistance gathers as momentum signals remain conflicted
The Ichimoku Kijun at $0.310 is acting as the nearest dynamic support, with MA-50 ($0.3241) and the $0.33 level providing immediate resistance overhead. Momentum signals are mixed: MACD remains a strong sell on D1, while the ADX is high, indicating a strong trend that currently favors sellers. The RSI supports buyers, but Stoch RSI and CCI indicate overbought conditions; Bull/Bear Power confirms ongoing buyer dominance. The Awesome Oscillator is neutral, providing little confirmation for the current upswing.
Bearish bias persists as upside constrained by weak indicators
For the next five sessions, Theta is expected to remain within the $0.315 – $0.345 volatility band relative to current levels. Current signals imply less than a 20% probability of a price increase, with a pullback more likely due to persistent bearish indicators on the weekly MACD, ADX, RSI, and longer-term moving averages. The baseline scenario is a sideways consolidation within this range. A bullish scenario would require a sustained breakthrough above $0.345 – $0.35 on strong volume, while a drop below $0.315 could trigger further weakness if sentiment deteriorates.
Previously it was reported that Theta is exhibiting short-term bullish momentum by trading above its MA-20 and Ichimoku Kijun, while continuing to face resistance from the MA-50 and pronounced medium- and long-term downtrends beneath the MA-200. Momentum indicators, including MACD and ADX, remain bearish and oscillators are overbought, suggesting elevated risk of volatility or reversal, with consolidation expected in a volatile band just below resistance and downside bias prevailing.


-
 Afghanistan
-
 Albania
-
 Algeria
-
 Angola
-
 Argentina
-
 Armenia
-
 Australia
-
 Austria
-
 Azerbaijan
-
 Bahamas
-
 Bahrain
-
 Bangladesh
-
 Belarus
-
 Belgium
-
 Bolivia
-
 Botswana
-
 Brazil
-
 Brunei
-
 Bulgaria
-
 Cambodia
-
 Cameroon
-
 Canada
-
 Chile
Chile
-
 China
China
-
 Colombia
-
 Congo
Congo
-
 Costa Rica
-
 Cote d'Ivoire
-
 Croatia
-
 Cuba
Cuba
-
 Cyprus
-
 Czechia
-
 DR Congo
-
 Denmark
-
 Dominican Republic
-
 Ecuador
-
 Egypt
Egypt
-
 El Salvador
-
 Estonia
-
 Eswatini
-
 Ethiopia
-
 Finland
-
 France
-
 Georgia
-
 Germany
-
 Ghana
Ghana
-
 Greece
-
 Haiti
Haiti
-
 Hong Kong
-
 Hungary
-
 India
India
-
 Indonesia
-
 Iran, Islamic republic
-
 Iraq
Iraq
-
 Ireland
-
 Israel
-
 Italy
Italy
-
 Jamaica
-
 Japan
Japan
-
 Jordan
-
 Kazakhstan
-
 Kenya
Kenya
-
 Korea
Korea
-
 Kuwait
-
 Kyrgyzstan
-
 Laos
Laos
-
 Latvia
-
 Lebanon
-
 Lesotho
-
 Libya
Libya
-
 Lithuania
-
 Luxembourg
-
 Madagascar
-
 Malaysia
-
 Malta
Malta
-
 Mauritius
-
 Mexico
-
 Moldova
-
 Mongolia
-
 Montenegro
-
 Morocco
-
 Mozambique
-
 Myanmar
-
 Namibia
-
 Nepal
Nepal
-
 Netherlands
-
 New Zealand
-
 Nigeria
-
 North Macedonia
-
 Norway
-
 Oman
Oman
-
 Pakistan
-
 Palestine
-
 Panama
-
 Papua New Guinea
-
 Paraguay
-
 Peru
Peru
-
 Philippines
-
 Poland
-
 Portugal
-
 Puerto Rico
-
 Qatar
Qatar
-
 Reunion
-
 Romania
-
 Rwanda
-
 Saudi Arabia
-
 Serbia
-
 Singapore
-
 Slovakia
-
 Slovenia
-
 Somalia
-
 South Africa
-
 Spain
Spain
-
 Sri Lanka
-
 Sweden
-
 Switzerland
-
 Syria
Syria
-
 Taiwan
-
 Tajikistan
-
 Tanzania
-
 Thailand
-
 Trinidad and Tobago
-
 Tunisia
-
 Turkey
-
 UAE
UAE
-
 Uganda
-
 Ukraine
-
 United Kingdom
-
United States
-
 Uruguay
-
 Uzbekistan
-
 Venezuela
-
 Vietnam
-
 Yemen
Yemen
-
 Zambia
-
 Zimbabwe
- Forex
- Crypto
