
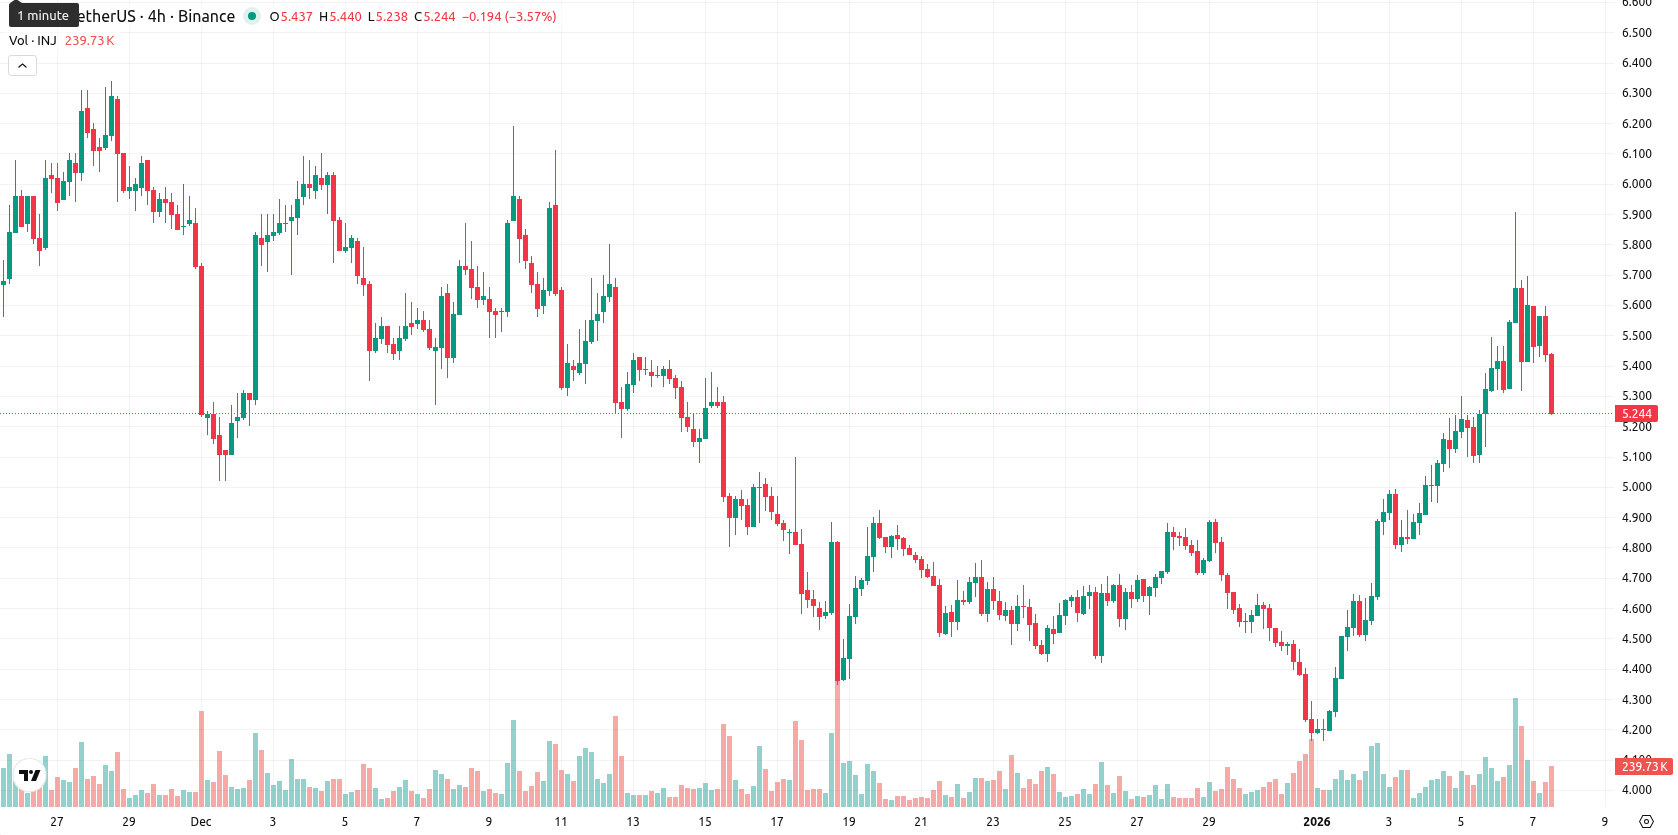
-7.16% for Injective — session low hit after volatile trading and overbought signals

Injective (INJ) is trading at $5.30 after a high-volatility session, having tumbled 7.16% to near the session low. The token sits above the MA-20 ($4.74) and MA-50 ($5.28) moving averages, reinforcing a short- to medium-term bullish tone, but remains well below the MA-200 ($10.10), which keeps longer-term sentiment cautious.
Highlights
- Injective's decentralized financial orderbook infrastructure reached a total market cap of approximately $515 million, indicating expanding ecosystem traction.
- The protocol's deflationary mechanism burned $39.5 million worth of tokens via ongoing buybacks, supporting its value accrual strategy.
- Real-world asset perpetual markets on Injective exceeded $6 billion in volume, reflecting increased institutional participation amid ongoing regulatory uncertainty and upcoming token unlocks.
Institutional inflows and deflationary moves counter regulatory uncertainty
Injective continues expanding its decentralized financial orderbook infrastructure, with its total market cap recently cited around $515 million. The protocol's deflationary mechanism resulted in $39.5 million worth of tokens being burned as part of ongoing buybacks, while real-world asset perpetual markets surpassed $6 billion in volume, signaling growing institutional participation. The ecosystem is also navigating regulatory uncertainty and upcoming token unlocks.
Mixed momentum signals as key resistance looms near overbought readings
Technically, INJ reflects a short- to medium-term bullish bias above both MA-20 and MA-50, but remains under long-term pressure below MA-200. Dynamic support aligns near the Ichimoku Kijun at $5.03, with the MA-50 ($5.28) and round $5.50 providing immediate resistance. Momentum signals are mixed: MACD is neutral, ADX supports an ongoing bullish trend, and RSI at 60.65 remains bullish; however, the Stochastic RSI and Commodity Channel Index both suggest overbought conditions. Bull/Bear Power shows buyers still in control, but at potentially exhausted levels, while the Awesome Oscillator confirms strong underlying strength. Price action opened flat before tumbling 7.16%, now hugging the session low — a sign that intraday caution is warranted despite prior upside.
Downside risk prevails amid heightened volatility and weak breakout odds
Looking ahead, INJ is likely to remain volatile, with a typical trading range anticipated between $5.10 and $5.60 over the next five days. The probability of sustained increases appears low (below 20%), favoring sideways or downward scenarios within this volatility band. Sustained movement above $5.50–$5.60 could prompt a rebound, but a clear move below $5.10 would confirm increased downside risk, echoing bearish weekly chart signals.
Previously it was reported that Injective is trading above its 20- and 50-day moving averages but remains below the 200-day, indicating short- and medium-term bullish momentum while facing longer-term resistance. Mixed technical indicators—MACD in sell territory, intraday ADX strength, supportive RSI, but overbought oscillators—highlight ongoing volatility and a market dominated by active buyers near key resistance levels.


Latest Injective News


-
 Afghanistan
-
 Albania
-
 Algeria
-
 Angola
-
 Argentina
-
 Armenia
-
 Australia
-
 Austria
-
 Azerbaijan
-
 Bahamas
-
 Bahrain
-
 Bangladesh
-
 Belarus
-
 Belgium
-
 Bolivia
-
 Botswana
-
 Brazil
-
 Brunei
-
 Bulgaria
-
 Cambodia
-
 Cameroon
-
 Canada
-
 Chile
Chile
-
 China
China
-
 Colombia
-
 Congo
Congo
-
 Costa Rica
-
 Cote d'Ivoire
-
 Croatia
-
 Cuba
Cuba
-
 Cyprus
-
 Czechia
-
 DR Congo
-
 Denmark
-
 Dominican Republic
-
 Ecuador
-
 Egypt
Egypt
-
 El Salvador
-
 Estonia
-
 Eswatini
-
 Ethiopia
-
 Finland
-
 France
-
 Georgia
-
 Germany
-
 Ghana
Ghana
-
 Greece
-
 Haiti
Haiti
-
 Hong Kong
-
 Hungary
-
 India
India
-
 Indonesia
-
 Iran, Islamic republic
-
 Iraq
Iraq
-
 Ireland
-
 Israel
-
 Italy
Italy
-
 Jamaica
-
 Japan
Japan
-
 Jordan
-
 Kazakhstan
-
 Kenya
Kenya
-
 Korea
Korea
-
 Kuwait
-
 Kyrgyzstan
-
 Laos
Laos
-
 Latvia
-
 Lebanon
-
 Lesotho
-
 Libya
Libya
-
 Lithuania
-
 Luxembourg
-
 Madagascar
-
 Malaysia
-
 Malta
Malta
-
 Mauritius
-
 Mexico
-
 Moldova
-
 Mongolia
-
 Montenegro
-
 Morocco
-
 Mozambique
-
 Myanmar
-
 Namibia
-
 Nepal
Nepal
-
 Netherlands
-
 New Zealand
-
 Nigeria
-
 North Macedonia
-
 Norway
-
 Oman
Oman
-
 Pakistan
-
 Palestine
-
 Panama
-
 Papua New Guinea
-
 Paraguay
-
 Peru
Peru
-
 Philippines
-
 Poland
-
 Portugal
-
 Puerto Rico
-
 Qatar
Qatar
-
 Reunion
-
 Romania
-
 Rwanda
-
 Saudi Arabia
-
 Serbia
-
 Singapore
-
 Slovakia
-
 Slovenia
-
 Somalia
-
 South Africa
-
 Spain
Spain
-
 Sri Lanka
-
 Sweden
-
 Switzerland
-
 Syria
Syria
-
 Taiwan
-
 Tajikistan
-
 Tanzania
-
 Thailand
-
 Trinidad and Tobago
-
 Tunisia
-
 Turkey
-
 UAE
UAE
-
 Uganda
-
 Ukraine
-
 United Kingdom
-
United States
-
 Uruguay
-
 Uzbekistan
-
 Venezuela
-
 Vietnam
-
 Yemen
Yemen
-
 Zambia
-
 Zimbabwe
- Forex
- Crypto
