
Curve price prediction: further losses likely as CRV tumbles beneath support

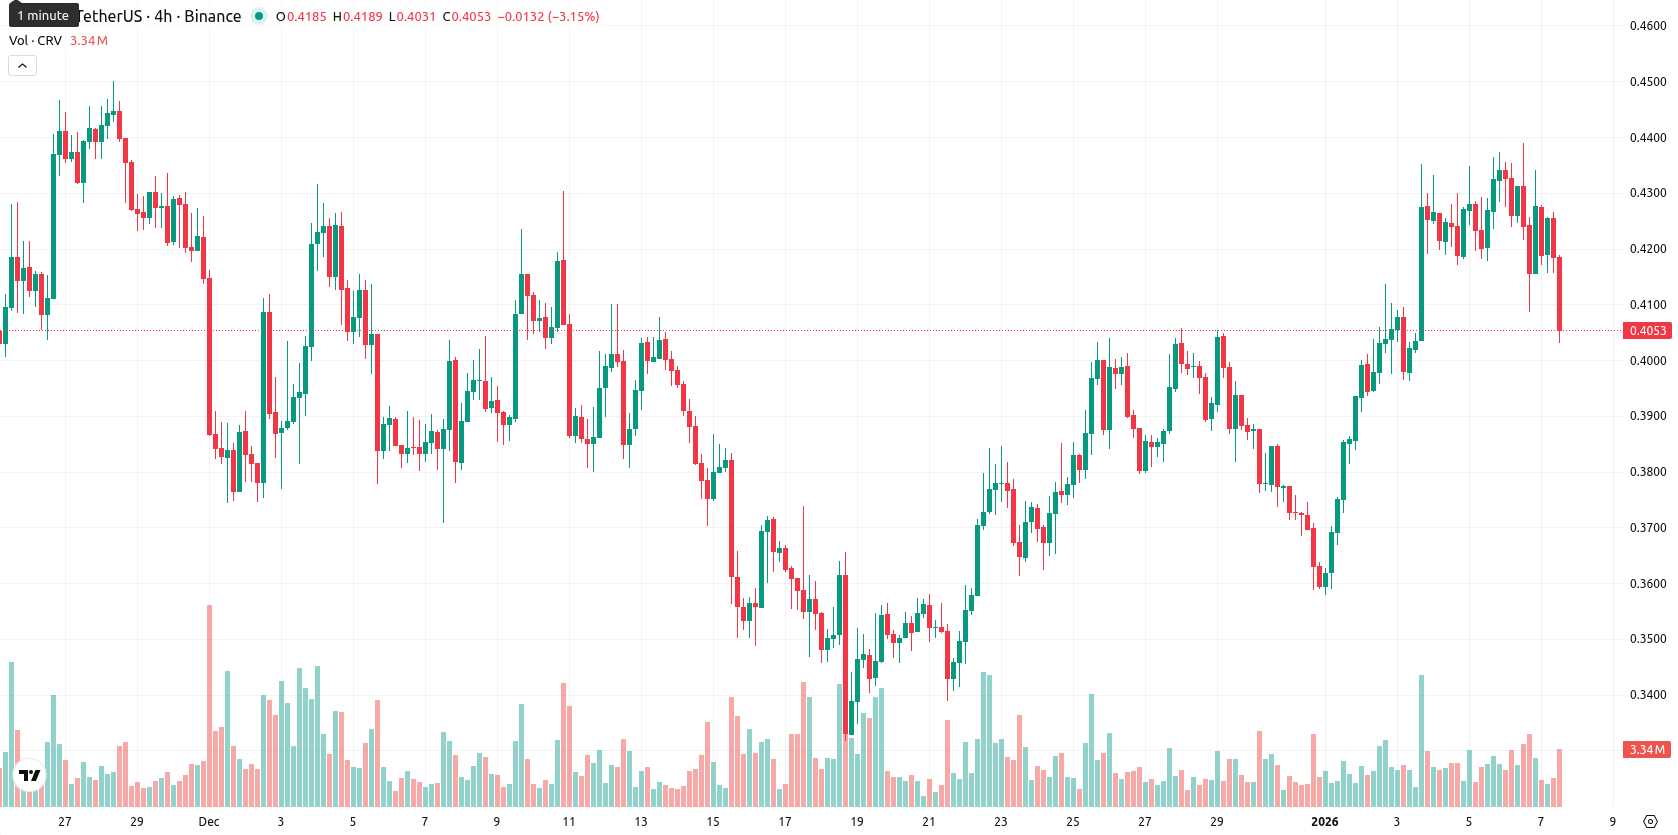
Curve (CRV) is currently trading at $0.4054, which is above both the MA-20 ($0.3863) and MA-50 ($0.3942) but remains well below the MA-200 ($0.6289). This positioning signals short- and medium-term recovery, though the longer-term trend still shows bearish pressure, with the nearest dynamic support at the Ichimoku Kijun ($0.3853) and resistance at MA-50 ($0.3942).
 0.2202
0.2303
0.2202
0.2303
Highlights
- CRV trades at $0.4054, above the MA-20 ($0.3863) and MA-50 ($0.3942), but remains significantly below the longer-term MA-200 ($0.6289).
- Daily MACD is in buy territory, but a weak ADX (14) and overbought Stochastic RSI and CCI warn of fading upside momentum and high volatility.
- Continued sideways movement is expected between $0.3950 and $0.4200, with bearish risk if support at $0.3950 fails and no weekly buy signals present.
Mixed momentum and elevated risk as overbought signals clash
Momentum indicators paint a mixed picture: MACD on the daily chart remains in buy territory, while ADX is weak at 14, indicating that any current trend has low strength and is not well-defined. Overbought conditions are noted across the Stochastic RSI and Commodity Channel Index, while RSI stands in bullish territory — this divergence suggests caution as upside momentum may be fading. Bull/Bear Power is inching positive, hinting at marginal buyer dominance intraday, but the Awesome Oscillator’s buy signal only subtly supports this. The price opened without a significant gap and quickly moved lower, now sitting near today’s low after dropping 7.29%, with intraday volatility characterized as high and downside pressure present after the open.
Limited upside as lack of buy signals supports bearish outlook
Looking ahead to the next five trading days, the expected price range is adjusted to $0.3950 to $0.4200 to reflect current volatility and price location. The probability of a further price increase is very low, as there are no weekly Buy signals among RSI, ADX, MACD, or MA-50, making a decrease much more likely. The baseline scenario favors continued sideways movement between support and resistance, while a bullish case would require a clear break above the $0.42 resistance zone. Conversely, a bearish scenario could see price action slipping below the $0.3950 support, exposing CRV to renewed selling toward prior lows.
Last time, analysts noted that Curve was trading above its short- and medium-term moving averages, exhibiting short-term bullish momentum, but remained below its long-term moving average, indicating continued weakness in the broader trend. Momentum indicators such as RSI and Stoch RSI signaled overbought conditions, suggesting near-term consolidation below key resistance, with potential downside risk should support levels fail to hold.







-
 Afghanistan
-
 Albania
-
 Algeria
-
 Angola
-
 Argentina
-
 Armenia
-
 Australia
-
 Austria
-
 Azerbaijan
-
 Bahamas
-
 Bahrain
-
 Bangladesh
-
 Belarus
-
 Belgium
-
 Bolivia
-
 Botswana
-
 Brazil
-
 Brunei
-
 Bulgaria
-
 Cambodia
-
 Cameroon
-
 Canada
-
 Chile
Chile
-
 China
China
-
 Colombia
-
 Congo
Congo
-
 Costa Rica
-
 Cote d'Ivoire
-
 Croatia
-
 Cuba
Cuba
-
 Cyprus
-
 Czechia
-
 DR Congo
-
 Denmark
-
 Dominican Republic
-
 Ecuador
-
 Egypt
Egypt
-
 El Salvador
-
 Estonia
-
 Eswatini
-
 Ethiopia
-
 Finland
-
 France
-
 Georgia
-
 Germany
-
 Ghana
Ghana
-
 Greece
-
 Haiti
Haiti
-
 Hong Kong
-
 Hungary
-
 India
India
-
 Indonesia
-
 Iran, Islamic republic
-
 Iraq
Iraq
-
 Ireland
-
 Israel
-
 Italy
Italy
-
 Jamaica
-
 Japan
Japan
-
 Jordan
-
 Kazakhstan
-
 Kenya
Kenya
-
 Korea
Korea
-
 Kuwait
-
 Kyrgyzstan
-
 Laos
Laos
-
 Latvia
-
 Lebanon
-
 Lesotho
-
 Libya
Libya
-
 Lithuania
-
 Luxembourg
-
 Madagascar
-
 Malaysia
-
 Malta
Malta
-
 Mauritius
-
 Mexico
-
 Moldova
-
 Mongolia
-
 Montenegro
-
 Morocco
-
 Mozambique
-
 Myanmar
-
 Namibia
-
 Nepal
Nepal
-
 Netherlands
-
 New Zealand
-
 Nigeria
-
 North Macedonia
-
 Norway
-
 Oman
Oman
-
 Pakistan
-
 Palestine
-
 Panama
-
 Papua New Guinea
-
 Paraguay
-
 Peru
Peru
-
 Philippines
-
 Poland
-
 Portugal
-
 Puerto Rico
-
 Qatar
Qatar
-
 Reunion
-
 Romania
-
 Rwanda
-
 Saudi Arabia
-
 Serbia
-
 Singapore
-
 Slovakia
-
 Slovenia
-
 Somalia
-
 South Africa
-
 Spain
Spain
-
 Sri Lanka
-
 Sweden
-
 Switzerland
-
 Syria
Syria
-
 Taiwan
-
 Tajikistan
-
 Tanzania
-
 Thailand
-
 Trinidad and Tobago
-
 Tunisia
-
 Turkey
-
 UAE
UAE
-
 Uganda
-
 Ukraine
-
 United Kingdom
-
United States
-
 Uruguay
-
 Uzbekistan
-
 Venezuela
-
 Vietnam
-
 Yemen
Yemen
-
 Zambia
-
 Zimbabwe
- Forex
- Crypto











