
Pepe: mixed technicals and selling pressure trigger 3.58% dip

Pepe (PEPE) is currently trading at $0.0000059, positioned above the MA-20 ($0.00000506) and MA-50 ($0.00000466), but well below the MA-200 ($0.00000832). This setup signals short- and medium-term bullish momentum but persistent long-term resistance, with the nearest dynamic support aligning with the Ichimoku Kijun at $0.00000545 and the MA-50 as resistance near $0.00000466.
 0.0530
0.052950
0.0530
0.052950
Highlights
- Pepe is experiencing continued selling pressure after its major rally, primarily from profit-taking and decreased on-chain activity following early strong performance.
- Institutional inflows via ETFs have increased alongside a resurgence in speculative trading interest in high-volatility assets such as Pepe.
- Pepe is being integrated into NFT gaming projects, signaling a potential expansion of its utility beyond speculative trading.
Institutional inflows and new integrations offset profit-taking pressure
Pepe has seen ongoing selling pressure following a major rally, largely attributed to profit-taking and reduced on-chain activity after significant early performance. The token has attracted notable institutional inflows through ETFs and renewed speculative interest in high-volatility assets. Some reports also indicate that Pepe is being integrated into NFT gaming projects, suggesting an expanding use case.
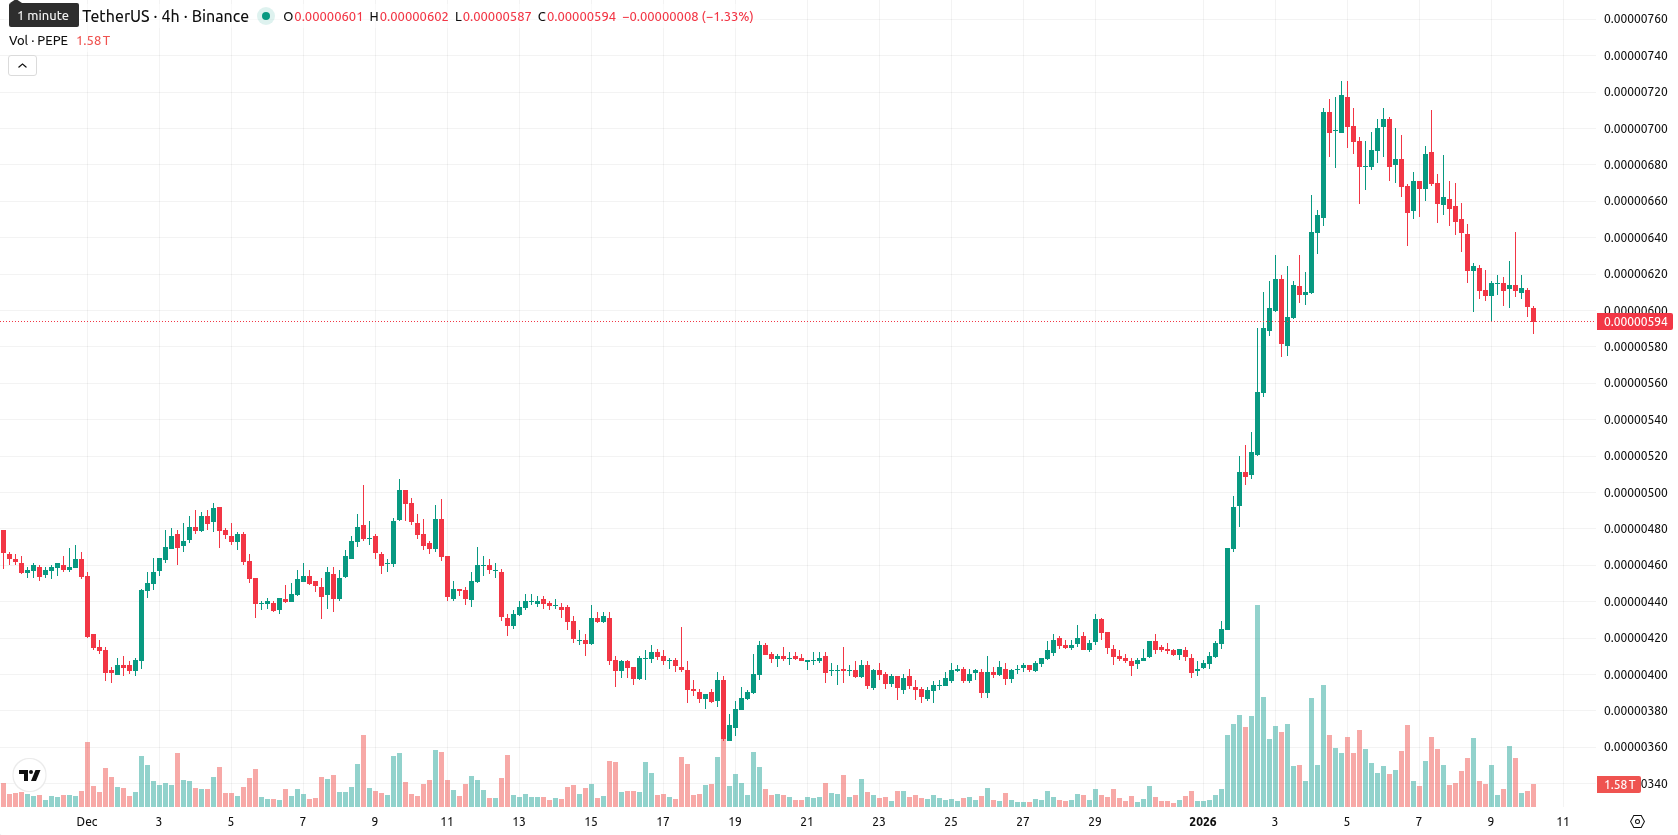
Conflicting momentum signals as daily strength clashes with intraday declines
Momentum indicators on the daily timeframe are mixed. The MACD gives a Buy rating, and ADX at 34.5 confirms a strong prevailing trend. The RSI at 62 and CCI at 68 indicate slight bullishness without acute overbought conditions, while the Stochastic RSI signals neutrality. Bull/Bear Power turns positive, suggesting buyers still hold the upper hand intraday despite today's decline. The Awesome Oscillator is neutral and does not confirm the trend. Price declined by 3.58% from the previous session, opening just below yesterday’s close with no significant gap. At the moment, the price sits at the lower end of today’s narrow range, indicating low volatility and modest seller pressure after the open. There is divergence between strong daily momentum and short-term losses, pointing to corrective moves within a larger upward structure.
Sideways trade expected as downside risk outweighs rally prospects
For the upcoming week, the typical volatility band sits between $0.0000053 and $0.0000062, adjusted for current price proximity and recent volatility. The probability of a price increase is very low (less than 20%), while further downside appears more likely as most weekly indicators signal 'Sell.' The base scenario is sideways consolidation within this defined range. A break above $0.0000062 could spark a short-term rally toward the next resistance, but sustained movement below $0.00000545 may open the door to deeper corrections.
Last time, analysts noted that Pepe closed the week sharply lower and remains in a bearish trend, trading below key moving averages with technical indicators such as MACD signaling a strong sell and oscillators like RSI and CCI reflecting weak momentum. The token is expected to consolidate amid continued volatility, with downside risks prevailing unless a clear breakout above the immediate resistance level occurs.








-
 Afghanistan
-
 Albania
-
 Algeria
-
 Angola
-
 Argentina
-
 Armenia
-
 Australia
-
 Austria
-
 Azerbaijan
-
 Bahamas
-
 Bahrain
-
 Bangladesh
-
 Belarus
-
 Belgium
-
 Bolivia
-
 Botswana
-
 Brazil
-
 Brunei
-
 Bulgaria
-
 Cambodia
-
 Cameroon
-
 Canada
-
 Chile
Chile
-
 China
China
-
 Colombia
-
 Congo
Congo
-
 Costa Rica
-
 Cote d'Ivoire
-
 Croatia
-
 Cuba
Cuba
-
 Cyprus
-
 Czechia
-
 DR Congo
-
 Denmark
-
 Dominican Republic
-
 Ecuador
-
 Egypt
Egypt
-
 El Salvador
-
 Estonia
-
 Eswatini
-
 Ethiopia
-
 Finland
-
 France
-
 Georgia
-
 Germany
-
 Ghana
Ghana
-
 Greece
-
 Haiti
Haiti
-
 Hong Kong
-
 Hungary
-
 India
India
-
 Indonesia
-
 Iran, Islamic republic
-
 Iraq
Iraq
-
 Ireland
-
 Israel
-
 Italy
Italy
-
 Jamaica
-
 Japan
Japan
-
 Jordan
-
 Kazakhstan
-
 Kenya
Kenya
-
 Korea
Korea
-
 Kuwait
-
 Kyrgyzstan
-
 Laos
Laos
-
 Latvia
-
 Lebanon
-
 Lesotho
-
 Libya
Libya
-
 Lithuania
-
 Luxembourg
-
 Madagascar
-
 Malaysia
-
 Malta
Malta
-
 Mauritius
-
 Mexico
-
 Moldova
-
 Mongolia
-
 Montenegro
-
 Morocco
-
 Mozambique
-
 Myanmar
-
 Namibia
-
 Nepal
Nepal
-
 Netherlands
-
 New Zealand
-
 Nigeria
-
 North Macedonia
-
 Norway
-
 Oman
Oman
-
 Pakistan
-
 Palestine
-
 Panama
-
 Papua New Guinea
-
 Paraguay
-
 Peru
Peru
-
 Philippines
-
 Poland
-
 Portugal
-
 Puerto Rico
-
 Qatar
Qatar
-
 Reunion
-
 Romania
-
 Rwanda
-
 Saudi Arabia
-
 Serbia
-
 Singapore
-
 Slovakia
-
 Slovenia
-
 Somalia
-
 South Africa
-
 Spain
Spain
-
 Sri Lanka
-
 Sweden
-
 Switzerland
-
 Syria
Syria
-
 Taiwan
-
 Tajikistan
-
 Tanzania
-
 Thailand
-
 Trinidad and Tobago
-
 Tunisia
-
 Turkey
-
 UAE
UAE
-
 Uganda
-
 Ukraine
-
 United Kingdom
-
United States
-
 Uruguay
-
 Uzbekistan
-
 Venezuela
-
 Vietnam
-
 Yemen
Yemen
-
 Zambia
-
 Zimbabwe
- Forex
- Crypto











