
Shiba Inu: conflicting oscillators drive sideways action despite bullish intraday momentum

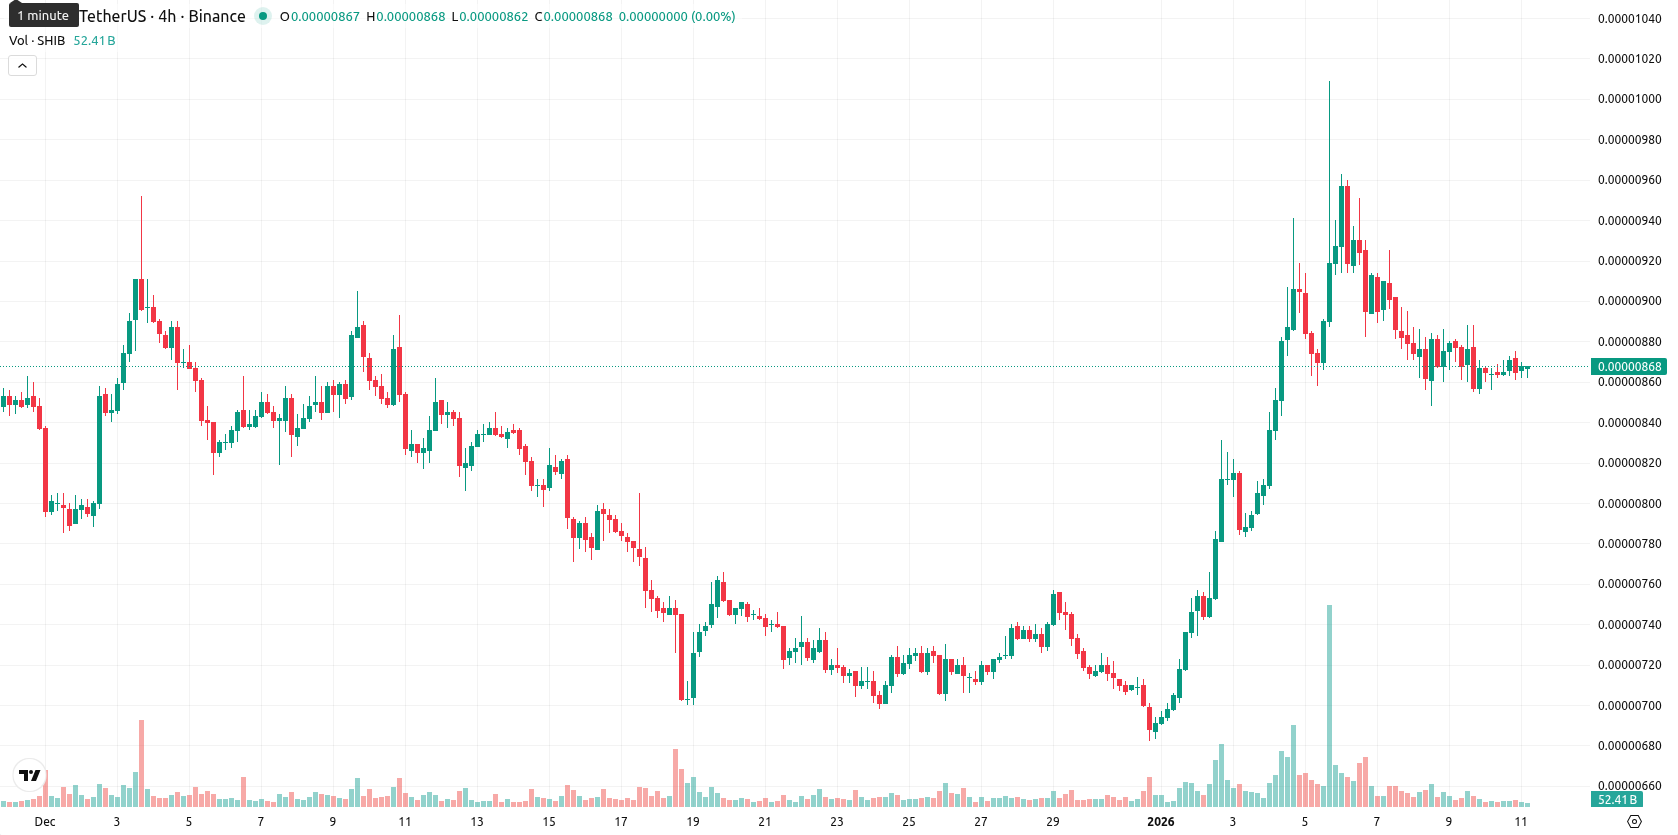
Shiba Inu (SHIB) is trading at $0.0000087, currently above both the MA-20 ($0.00000787) and MA-50 ($0.00000808), but well below the MA-200 ($0.00001094). This positioning suggests a short- to medium-term bullish bias, while the longer-term trend remains under pressure from sellers, with dynamic support near the Ichimoku Kijun at $0.00000849 and MA-50 acting as nearby resistance.
Highlights
- SHIB trades at $0.0000087, above its MA-20 ($0.00000787) and MA-50 ($0.00000808) but far below MA-200 ($0.00001094), reflecting a short-term bullish bias amid long-term pressure.
- Daily momentum indicators are mixed, with MACD bullish, ADX at 25.8 indicating trend strength, and RSI (58.3) and CCI (69.7) showing mild bullishness without overbought signals.
- The expected range for the coming week is $0.00000820 to $0.00000876, with a higher probability of sideways or bearish moves unless SHIB breaks above $0.00000876.
Mixed momentum and firm range as buyers lead but signals diverge
Momentum indicators on the daily chart are mixed: the MACD signals bullish momentum, and the ADX (25.8) points to a strengthening trend, but oscillators are conflicting. The RSI (58.3) and CCI (69.7) indicate mild bullishness without overbought conditions, while the Stochastic RSI remains neutral. Bull/Bear Power shows buyers dominating in the short term. There was no gap between yesterday’s close and today’s open, and the price is currently at the top of today's range ($0.0000087 vs. $0.0000086 – $0.0000087), suggesting low volatility and a firm tone near session highs. While daily momentum and intraday buyers are aligned, the overall mix of oscillators reflects underlying divergence and warrants caution.
Sideways outlook as downside risk prevails over weak breakout odds
For the coming week, the expected trading range is $0.00000820 to $0.00000876, keeping price fluctuations within a typical volatility band relative to current levels. There is a very low probability (less than 20%) that SHIB will break meaningfully higher, given the dominant bearish signals from weekly Moving Averages and MACD, while the chance of a decline is much more likely. The baseline scenario is sideways trading within the designated band. A bullish case would require a breakout above $0.00000876 and sustained buying, while a bearish scenario materializes if the price slips below $0.00000820, exposing it to additional downside.
Last time, analysts noted that Shiba Inu is trading near session lows, holding above its short- and medium-term moving averages but remaining below the long-term trend, reflecting a cautious near-term bullish bias amid persistent long-term risks. Momentum and oscillator signals are mixed, with immediate support at the Kijun, resistance near $0.00000900, and all major weekly indicators maintaining a bearish outlook that limits the probability of significant upside in the coming week.


-
 Afghanistan
-
 Albania
-
 Algeria
-
 Angola
-
 Argentina
-
 Armenia
-
 Australia
-
 Austria
-
 Azerbaijan
-
 Bahamas
-
 Bahrain
-
 Bangladesh
-
 Belarus
-
 Belgium
-
 Bolivia
-
 Botswana
-
 Brazil
-
 Brunei
-
 Bulgaria
-
 Cambodia
-
 Cameroon
-
 Canada
-
 Chile
Chile
-
 China
China
-
 Colombia
-
 Congo
Congo
-
 Costa Rica
-
 Cote d'Ivoire
-
 Croatia
-
 Cuba
Cuba
-
 Cyprus
-
 Czechia
-
 DR Congo
-
 Denmark
-
 Dominican Republic
-
 Ecuador
-
 Egypt
Egypt
-
 El Salvador
-
 Estonia
-
 Eswatini
-
 Ethiopia
-
 Finland
-
 France
-
 Georgia
-
 Germany
-
 Ghana
Ghana
-
 Greece
-
 Haiti
Haiti
-
 Hong Kong
-
 Hungary
-
 India
India
-
 Indonesia
-
 Iran, Islamic republic
-
 Iraq
Iraq
-
 Ireland
-
 Israel
-
 Italy
Italy
-
 Jamaica
-
 Japan
Japan
-
 Jordan
-
 Kazakhstan
-
 Kenya
Kenya
-
 Korea
Korea
-
 Kuwait
-
 Kyrgyzstan
-
 Laos
Laos
-
 Latvia
-
 Lebanon
-
 Lesotho
-
 Libya
Libya
-
 Lithuania
-
 Luxembourg
-
 Madagascar
-
 Malaysia
-
 Malta
Malta
-
 Mauritius
-
 Mexico
-
 Moldova
-
 Mongolia
-
 Montenegro
-
 Morocco
-
 Mozambique
-
 Myanmar
-
 Namibia
-
 Nepal
Nepal
-
 Netherlands
-
 New Zealand
-
 Nigeria
-
 North Macedonia
-
 Norway
-
 Oman
Oman
-
 Pakistan
-
 Palestine
-
 Panama
-
 Papua New Guinea
-
 Paraguay
-
 Peru
Peru
-
 Philippines
-
 Poland
-
 Portugal
-
 Puerto Rico
-
 Qatar
Qatar
-
 Reunion
-
 Romania
-
 Rwanda
-
 Saudi Arabia
-
 Serbia
-
 Singapore
-
 Slovakia
-
 Slovenia
-
 Somalia
-
 South Africa
-
 Spain
Spain
-
 Sri Lanka
-
 Sweden
-
 Switzerland
-
 Syria
Syria
-
 Taiwan
-
 Tajikistan
-
 Tanzania
-
 Thailand
-
 Trinidad and Tobago
-
 Tunisia
-
 Turkey
-
 UAE
UAE
-
 Uganda
-
 Ukraine
-
 United Kingdom
-
United States
-
 Uruguay
-
 Uzbekistan
-
 Venezuela
-
 Vietnam
-
 Yemen
Yemen
-
 Zambia
-
 Zimbabwe
- Forex
- Crypto
