
NEAR: Bullish MACD and strong buyer action drive price higher

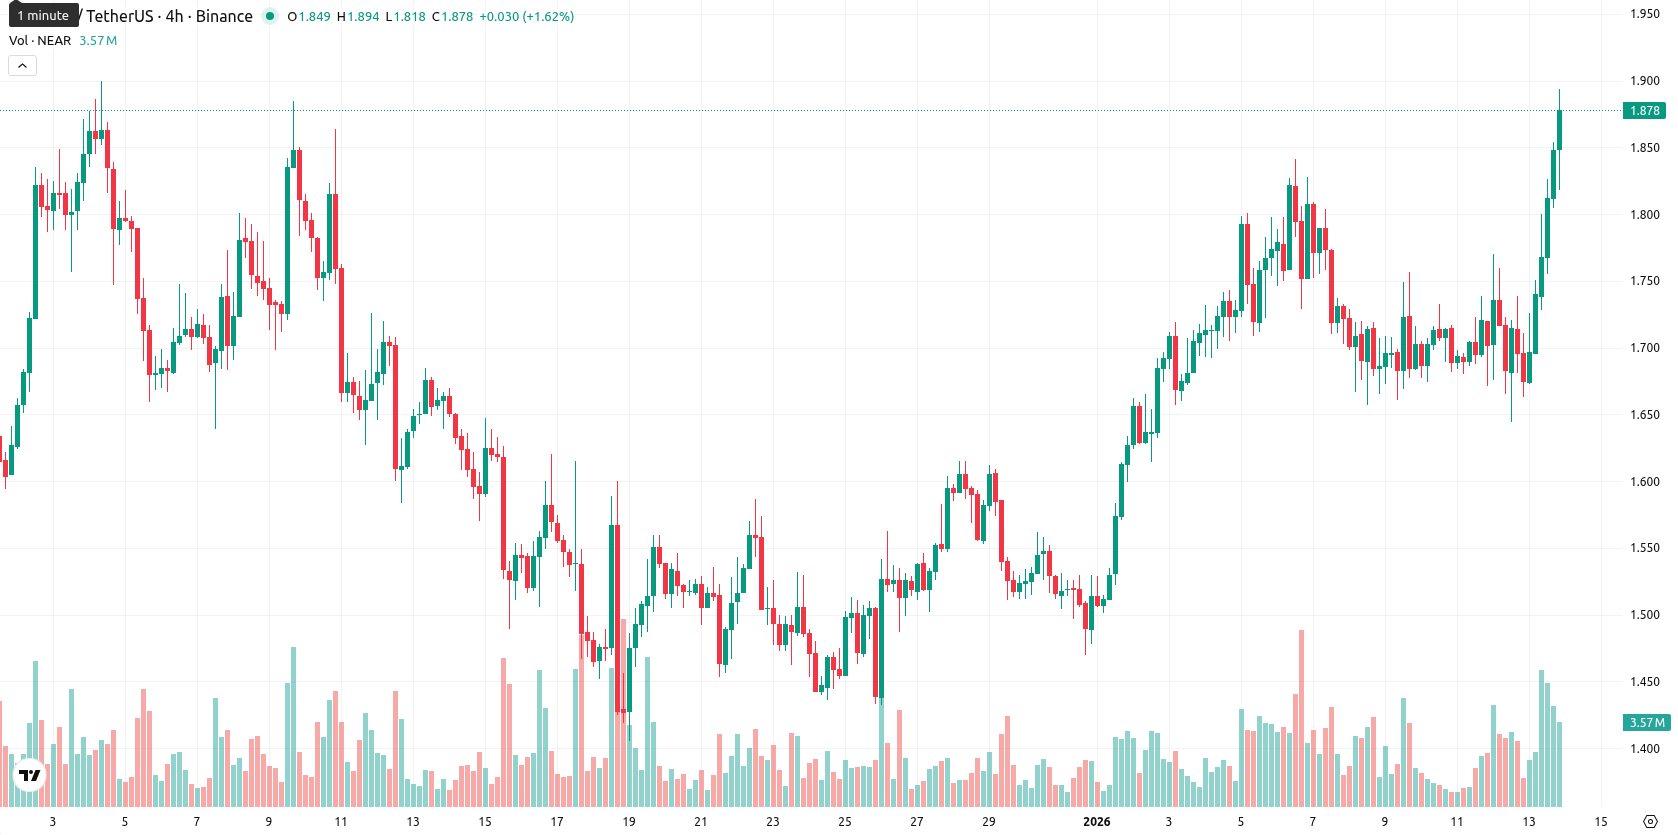
NEAR (NEAR) is trading at $1.873, up 11.42% from the previous session close. The asset is positioned above the MA-20 ($1.6331) and MA-50 ($1.6698), but remains below the longer-term MA-200 ($2.3202), suggesting a short-term bullish turnaround within an overall bearish structure.
Highlights
- NEAR trades at $1.873, up 11.42% from the previous close, exceeding MA-20 and MA-50 but remaining below the MA-200 resistance at $2.3202.
- Daily chart momentum is positive with a bullish MACD, neutral-to-bullish RSI at 50, ADX near 16 indicating moderate trend strength, and buyers dominating intraday.
- Expected trading range for the next five days is $1.70–$2.05, with sideways consolidation likely and less than 20% probability of further price increase.
Buyer dominance persists as balanced indicators cap upside
Technical analysis shows that NEAR is being supported near the Ichimoku Kijun level of $1.6230, with resistance around the MA-50 and the psychological $1.900 level. The daily chart momentum remains positive: the MACD is bullish and the ADX is at 16, indicating moderate trend strength. RSI sits at a neutral-to-bullish 50, and both the Stochastic RSI and CCI are neutral, which points to balanced momentum with no immediate overbought or oversold signals. Bull/Bear Power is positive, highlighting strong buyer dominance intraday, while the Awesome Oscillator is neutral and not signaling additional momentum support. Intraday trading has stayed near the session high, inside a volatile band between $1.6734 and $1.894, with buyers consistently pressing prices upward.
Sideways movement expected as volatility bands contain price
In the short term, NEAR is likely to trade within a typical volatility band spanning $1.70 to $2.05 over the next five days. The likelihood of a price increase beyond this range is low (less than 20%), with weekly moving averages and oscillators hinting at a consolidation phase. The base case scenario sees NEAR moving sideways between support at $1.70 and resistance at $2.05. A break above $2.05 could trigger further upside, while a drop below $1.70 may lead to a return toward the Ichimoku Kijun support at $1.62.
Previously it was reported that NEAR remains under persistent bearish pressure, trading well below all major weekly moving averages with weak and oversold momentum indicators, including MACD and RSI, and dynamic resistance set by the Ichimoku Kijun level. Immediate support lies near the recent low and the asset is expected to range sideways with downside risk dominating the outlook, as technical signals provide little evidence for a near-term rebound.


-
 Afghanistan
-
 Albania
-
 Algeria
-
 Angola
-
 Argentina
-
 Armenia
-
 Australia
-
 Austria
-
 Azerbaijan
-
 Bahamas
-
 Bahrain
-
 Bangladesh
-
 Belarus
-
 Belgium
-
 Bolivia
-
 Botswana
-
 Brazil
-
 Brunei
-
 Bulgaria
-
 Cambodia
-
 Cameroon
-
 Canada
-
 Chile
Chile
-
 China
China
-
 Colombia
-
 Congo
Congo
-
 Costa Rica
-
 Cote d'Ivoire
-
 Croatia
-
 Cuba
Cuba
-
 Cyprus
-
 Czechia
-
 DR Congo
-
 Denmark
-
 Dominican Republic
-
 Ecuador
-
 Egypt
Egypt
-
 El Salvador
-
 Estonia
-
 Eswatini
-
 Ethiopia
-
 Finland
-
 France
-
 Georgia
-
 Germany
-
 Ghana
Ghana
-
 Greece
-
 Haiti
Haiti
-
 Hong Kong
-
 Hungary
-
 India
India
-
 Indonesia
-
 Iran, Islamic republic
-
 Iraq
Iraq
-
 Ireland
-
 Israel
-
 Italy
Italy
-
 Jamaica
-
 Japan
Japan
-
 Jordan
-
 Kazakhstan
-
 Kenya
Kenya
-
 Korea
Korea
-
 Kuwait
-
 Kyrgyzstan
-
 Laos
Laos
-
 Latvia
-
 Lebanon
-
 Lesotho
-
 Libya
Libya
-
 Lithuania
-
 Luxembourg
-
 Madagascar
-
 Malaysia
-
 Malta
Malta
-
 Mauritius
-
 Mexico
-
 Moldova
-
 Mongolia
-
 Montenegro
-
 Morocco
-
 Mozambique
-
 Myanmar
-
 Namibia
-
 Nepal
Nepal
-
 Netherlands
-
 New Zealand
-
 Nigeria
-
 North Macedonia
-
 Norway
-
 Oman
Oman
-
 Pakistan
-
 Palestine
-
 Panama
-
 Papua New Guinea
-
 Paraguay
-
 Peru
Peru
-
 Philippines
-
 Poland
-
 Portugal
-
 Puerto Rico
-
 Qatar
Qatar
-
 Reunion
-
 Romania
-
 Rwanda
-
 Saudi Arabia
-
 Serbia
-
 Singapore
-
 Slovakia
-
 Slovenia
-
 Somalia
-
 South Africa
-
 Spain
Spain
-
 Sri Lanka
-
 Sweden
-
 Switzerland
-
 Syria
Syria
-
 Taiwan
-
 Tajikistan
-
 Tanzania
-
 Thailand
-
 Trinidad and Tobago
-
 Tunisia
-
 Turkey
-
 UAE
UAE
-
 Uganda
-
 Ukraine
-
 United Kingdom
-
United States
-
 Uruguay
-
 Uzbekistan
-
 Venezuela
-
 Vietnam
-
 Yemen
Yemen
-
 Zambia
-
 Zimbabwe
- Forex
- Crypto
